11 Customer Success Metrics You Should Know This 2024
Dive into essential customer success metrics, their role in loyalty and business benefits. Discover top tools like Omni24 for effective measurement and analysis.
Customer success strategy has always been the top priority for companies wanting to grow their customer base. But how do you measure the effectiveness of your customer success efforts?
A report by PWC found that one in every five customers will leave a brand after one bad experience, another 59% will walk away after multiple experiences. Customer success metrics are key performance indicators that help businesses track and evaluate the effectiveness of their success initiatives.
Let’s explore the importance of customer success metrics and how they can help businesses create more meaningful experiences.
Customer success metrics are key performance indicators (KPIs) that measure the effectiveness of a company’s efforts in ensuring that its customers are achieving their desired outcomes and are satisfied with the product or service they are utilizing. These metrics help businesses understand how well they are meeting their customers’ needs and ultimately drive customer loyalty as well as retention.
The key objectives of customer success metrics are to:
Customer success metrics provide valuable insights into how well a company is meeting its customers’ needs and expectations, which in turn directly impacts customer loyalty.
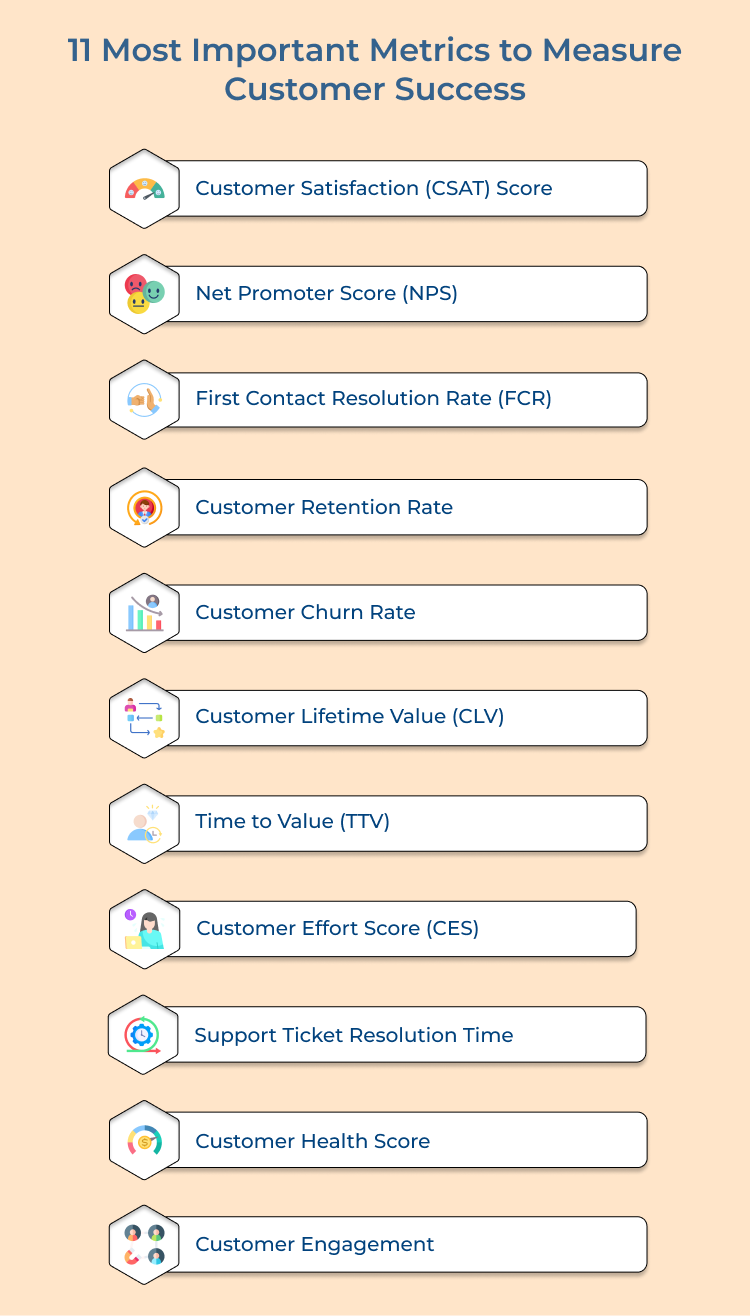
One of the most fundamental customer success metrics is the Customer Satisfaction (CSAT) score. The metric measures how satisfied customers are with a product or service, typically through a survey or feedback form. A high CSAT score indicates that customers are happy with their experience and are more likely to become repeat customers as well as brand advocates.
To calculate the CSAT score, you can use the following formula:

For example, if 80 out of 100 customers say they are satisfied with your product, the CSAT score would be 80%.
The Net Promoter Score (NPS) is another essential customer success metric that measures customer loyalty and advocacy. Customers are asked a single question: “On a scale of 0-10, how likely are you to recommend our company to a friend or colleague?” Based on their responses, customers are categorized as promoters, passives, or detractors. A high NPS indicates strong customer loyalty and a high likelihood of referrals as well as repeat business.
To calculate the NPS, you can use the following formula:
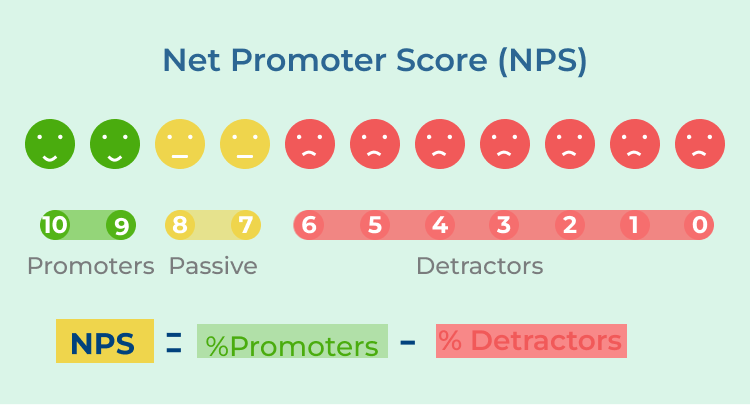
Promoters are customers who rate your brand a 9 or 10, while detractors are customers who rate your brand a 6 or below. For example, if 30% of customers are promoters and 10% are detractors, the NPS would be 20.
First Contact Resolution Rate (FCR) is a key performance indicator used by companies to measure the effectiveness of their customer service operations. It refers to the percentage of customer inquiries or issues that are resolved on the first contact with a customer service representative, without the need for any follow-up contact. A high FCR rate is typically seen as a sign of good customer service, as it indicates that customers are having their issues resolved quickly and efficiently.
Calculating FCR involves tracking the number of inquiries or issues that are resolved on the first contact, as well as the total number of inquiries received during a specific period of time. The formula for calculating FCR is:

For example, if a company receives 100 customer inquiries in a month and is able to resolve 80 of them on the first contact, the FCR rate would be:
FCR = (80/100) x 100 = 80%
Customer retention rate measures the percentage of customers who continue to do business with a company over a specified period of time. A high customer retention rate is a clear indicator of customer satisfaction, loyalty and the overall health of a business. When you understand customer retention rate, there is a higher chance in managing customer retention costs wisely as well. You also reduce churn rate and increase their lifetime value.
The formula for calculating this is:
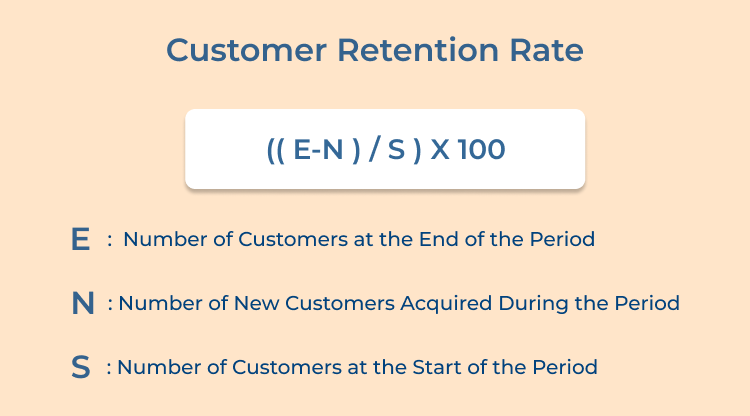
Example:
At the beginning of the month, you had 500 customers. During the month, you acquired 50 new customers and at the end of the month, you had 480 customers.
Customer Retention Rate = ((480-50)/500) x 100
Customer Retention Rate = (430/500) x 100
Customer Retention Rate = 86%
On the flip side, customer churn rate measures the percentage of customers who stop doing business with a company over a given period. High churn rates can indicate dissatisfaction with a product or service, poor customer support or competitive pressures. When churn rate falls, businesses improve customer retention, increase revenue and maintain long-term relationships with customers.
Customer Churn Rate is the percentage of customers who have stopped using a company’s product or service during a particular period. The formula for calculating this is:
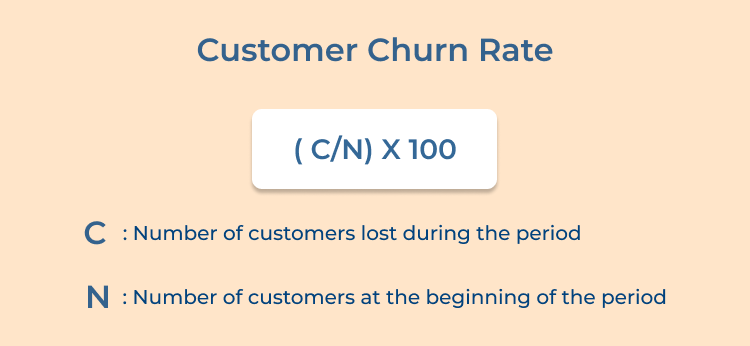
Example:
At the beginning of the month, you had 500 customers. During the month, 20 customers stopped using your service.
Customer Churn Rate = (20/500) x 100
Customer Churn Rate = 4%
Customer Lifetime Value (CLV) is a predictive metric that calculates the total value a customer is expected to bring to a business over the entirety of their relationship. By understanding the CLV of different customer segments, businesses customize marketing strategies, retention efforts and customer service to maximize long-term profitability.
Customer Lifetime Value is the prediction of the net profit attributed to the entire future relationship with a customer. The formula for calculating this is:
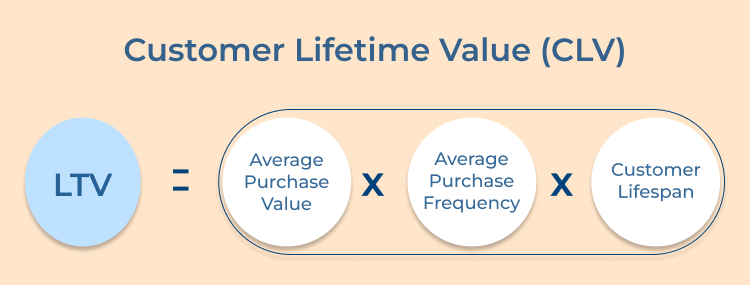
Example:
Average Purchase Value = $50
Average Purchase Frequency = 2 purchases per month
Customer Lifespan = 12 months
Customer Lifetime Value = $50 x 2 x 12
Customer Lifetime Value = $1,200
Time to Value (TTV) measures the amount of time it takes for a customer to realize the full value of a product or service after their initial purchase. A shorter TTV indicates that customers are quickly onboarded, engaged and deriving value from the product, leading to higher retention rates. Reduce TTV while accelerating customer success as well as drive positive outcomes.
Time to Value is the time it takes for a customer to realize the value of your product or service after the initial interaction. The formula for calculating this is:

Example:
Total Time to Value = 30 days
Onboarding Time = 5 days
Time to Value = 30 – 5
Time to Value = 25 days
Customer Effort Score (CES) measures the ease of doing business with a company, such as resolving issues, making purchases, or accessing support. A low CES indicates that customers have a seamless and positive experience, while a high CES suggests friction as well as frustration. Minimize customer effort to see the business improve satisfaction, loyalty and long-term relationships with customers.
The formula for calculating CES is:

For example, if 100 customers were surveyed and 70 of them rated their experience as easy (1 or 2 on a scale of 1-5), the CES score would be:
CES = (70/100) x 100 = 70%
Support ticket resolution time measures how quickly customer support agents resolve customer issues, inquiries, or requests. A shorter resolution time indicates responsive support and excellent service quality, while a longer resolution time may lead to customer frustration/dissatisfaction. Implementing a ticketing system, establishing service level agreements and training support staff can optimize resolution time as well as enhance customer support.
Formula:

For example, if a support team resolved 50 tickets in a total time of 100 hours, the calculation would be:
Support Ticket Resolution Time = 100 hours / 50 tickets = 2 hours per ticket
Customer Health Score is a composite metric that evaluates various customer success factors, such as usage metrics, engagement levels and sentiment analysis. By calculating a customer health score, SaaS companies can monitor customer satisfaction, retention risks and growth opportunities. A high customer health score indicates a healthy customer relationship, while a low score signals potential churn or dissatisfaction. Implementing customer health monitoring tools, conducting customer checkpoints and providing personalized interventions can improve customer health while driving long-term success.
Formula:

For example, if a customer has high usage, frequent engagement and positive feedback, their customer health score would be high. Conversely, if a customer has low usage, minimal engagement and negative feedback, their customer health score would be low.
Customer engagement metrics, such as active usage, average session duration and feature adoption rate, quantify how customers interact with the product or service. Analyzing customer engagement data helps SaaS companies identify trends, preferences and pain points that impact customer satisfaction. Improving product usability, enhancing user experience and providing training resources can boost customer engagement while driving product adoption.
Formula:

For example, if a company had 1000 interactions with customers in a month and had a total customer base of 10,000, the calculation would be:
Customer Engagement = (1000 / 10,000) * 100 = 10%
Why should you implement customer service metrics into your business workflow? Simply because it helps you lay strong future plans by gathering data from the past and present.
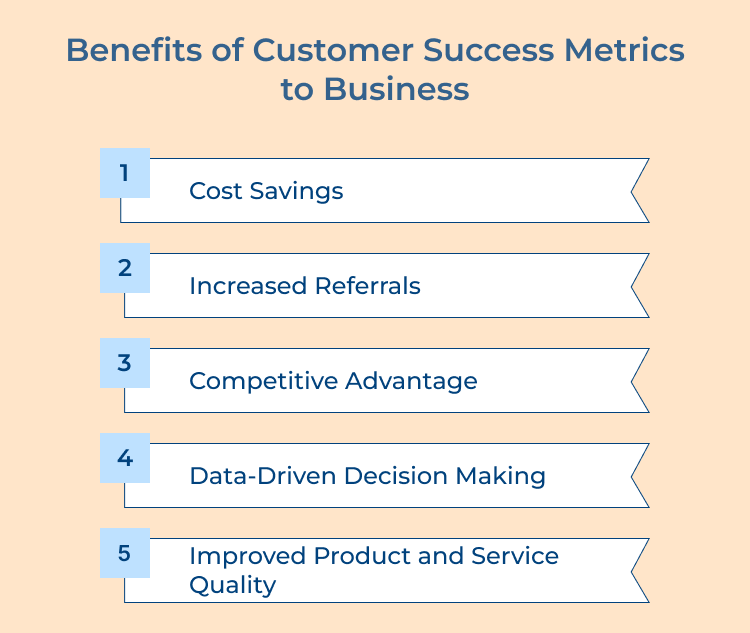
Customer success metrics gives you an overview on how well businesses are meeting their customer’s needs and make necessary improvements to drive growth.
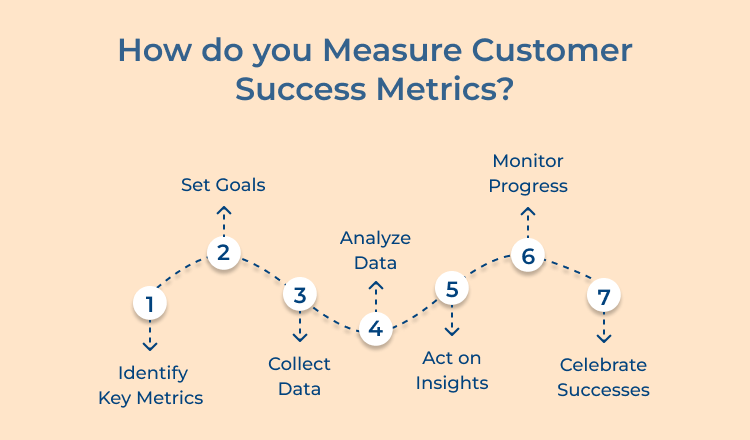
Define Key Performance Indicators (KPIs)
Identify the most relevant metrics for your business that reflect customer success. These may include customer satisfaction scores, retention rates, product usage frequency, and upsell/cross-sell rates. Align these KPIs with your overall business objectives and ensure they provide actionable insights. Consider both quantitative and qualitative measures to get a comprehensive view of customer success.
Establish Baseline Measurements
Before implementing any changes or improvements, gather current data for your chosen KPIs. The baseline will serve as a reference point for future comparisons. Collect data from various sources such as customer surveys, product analytics, and financial reports. Ensure the data is accurate and representative of your entire customer base to establish a reliable starting point.
Set Realistic Goals
Based on your baseline measurements and industry benchmarks, set achievable targets for each KPI. These goals should be specific, measurable, attainable, relevant, and time-bound (SMART). Consider both short-term as well as long-term objectives, and align them with your company’s growth strategy. Involve key stakeholders in goal-setting to ensure buy-in and support across the organization.
Implement Tracking Systems
Deploy robust tools to consistently track and measure your chosen metrics. This may include customer relationship management (CRM) software, analytics platforms, and survey tools. Ensure these systems integrate seamlessly with your existing infrastructure and provide real-time data whenever possible. Train your team on how to use these tools effectively to gather and interpret data.
Regularly Collect and Analyze Data
Establish a routine for data collection and analysis. This could be weekly, monthly, or quarterly, depending on your business needs. Look for trends, patterns, and correlations in the data. Identify areas of improvement and success stories. Use data visualization tools to make the information more accessible and easier to understand for all team members.
Act on Insights
Use the insights gained from your data analysis to drive improvements in your customer success strategies. Develop action plans to address any shortcomings or capitalize on successful approaches. This might involve adjusting your onboarding process, enhancing product features, or improving customer support. Continuously test and iterate on these improvements to optimize customer success.
Communicate Results and Adjust Goals
Share the results of your customer success metrics with relevant stakeholders, including leadership, customer-facing teams, and even customers themselves when appropriate. Use this feedback to refine your goals and metrics as needed. Regularly adjust your KPIs to ensure they remain relevant and aligned with your evolving business objectives. Celebrate successes and learn from setbacks to create a culture of continuous improvement.
There are several software tools available that can help you track and analyze these metrics effectively. Here are the top 4 software tools that can be used to measure customer success metrics:
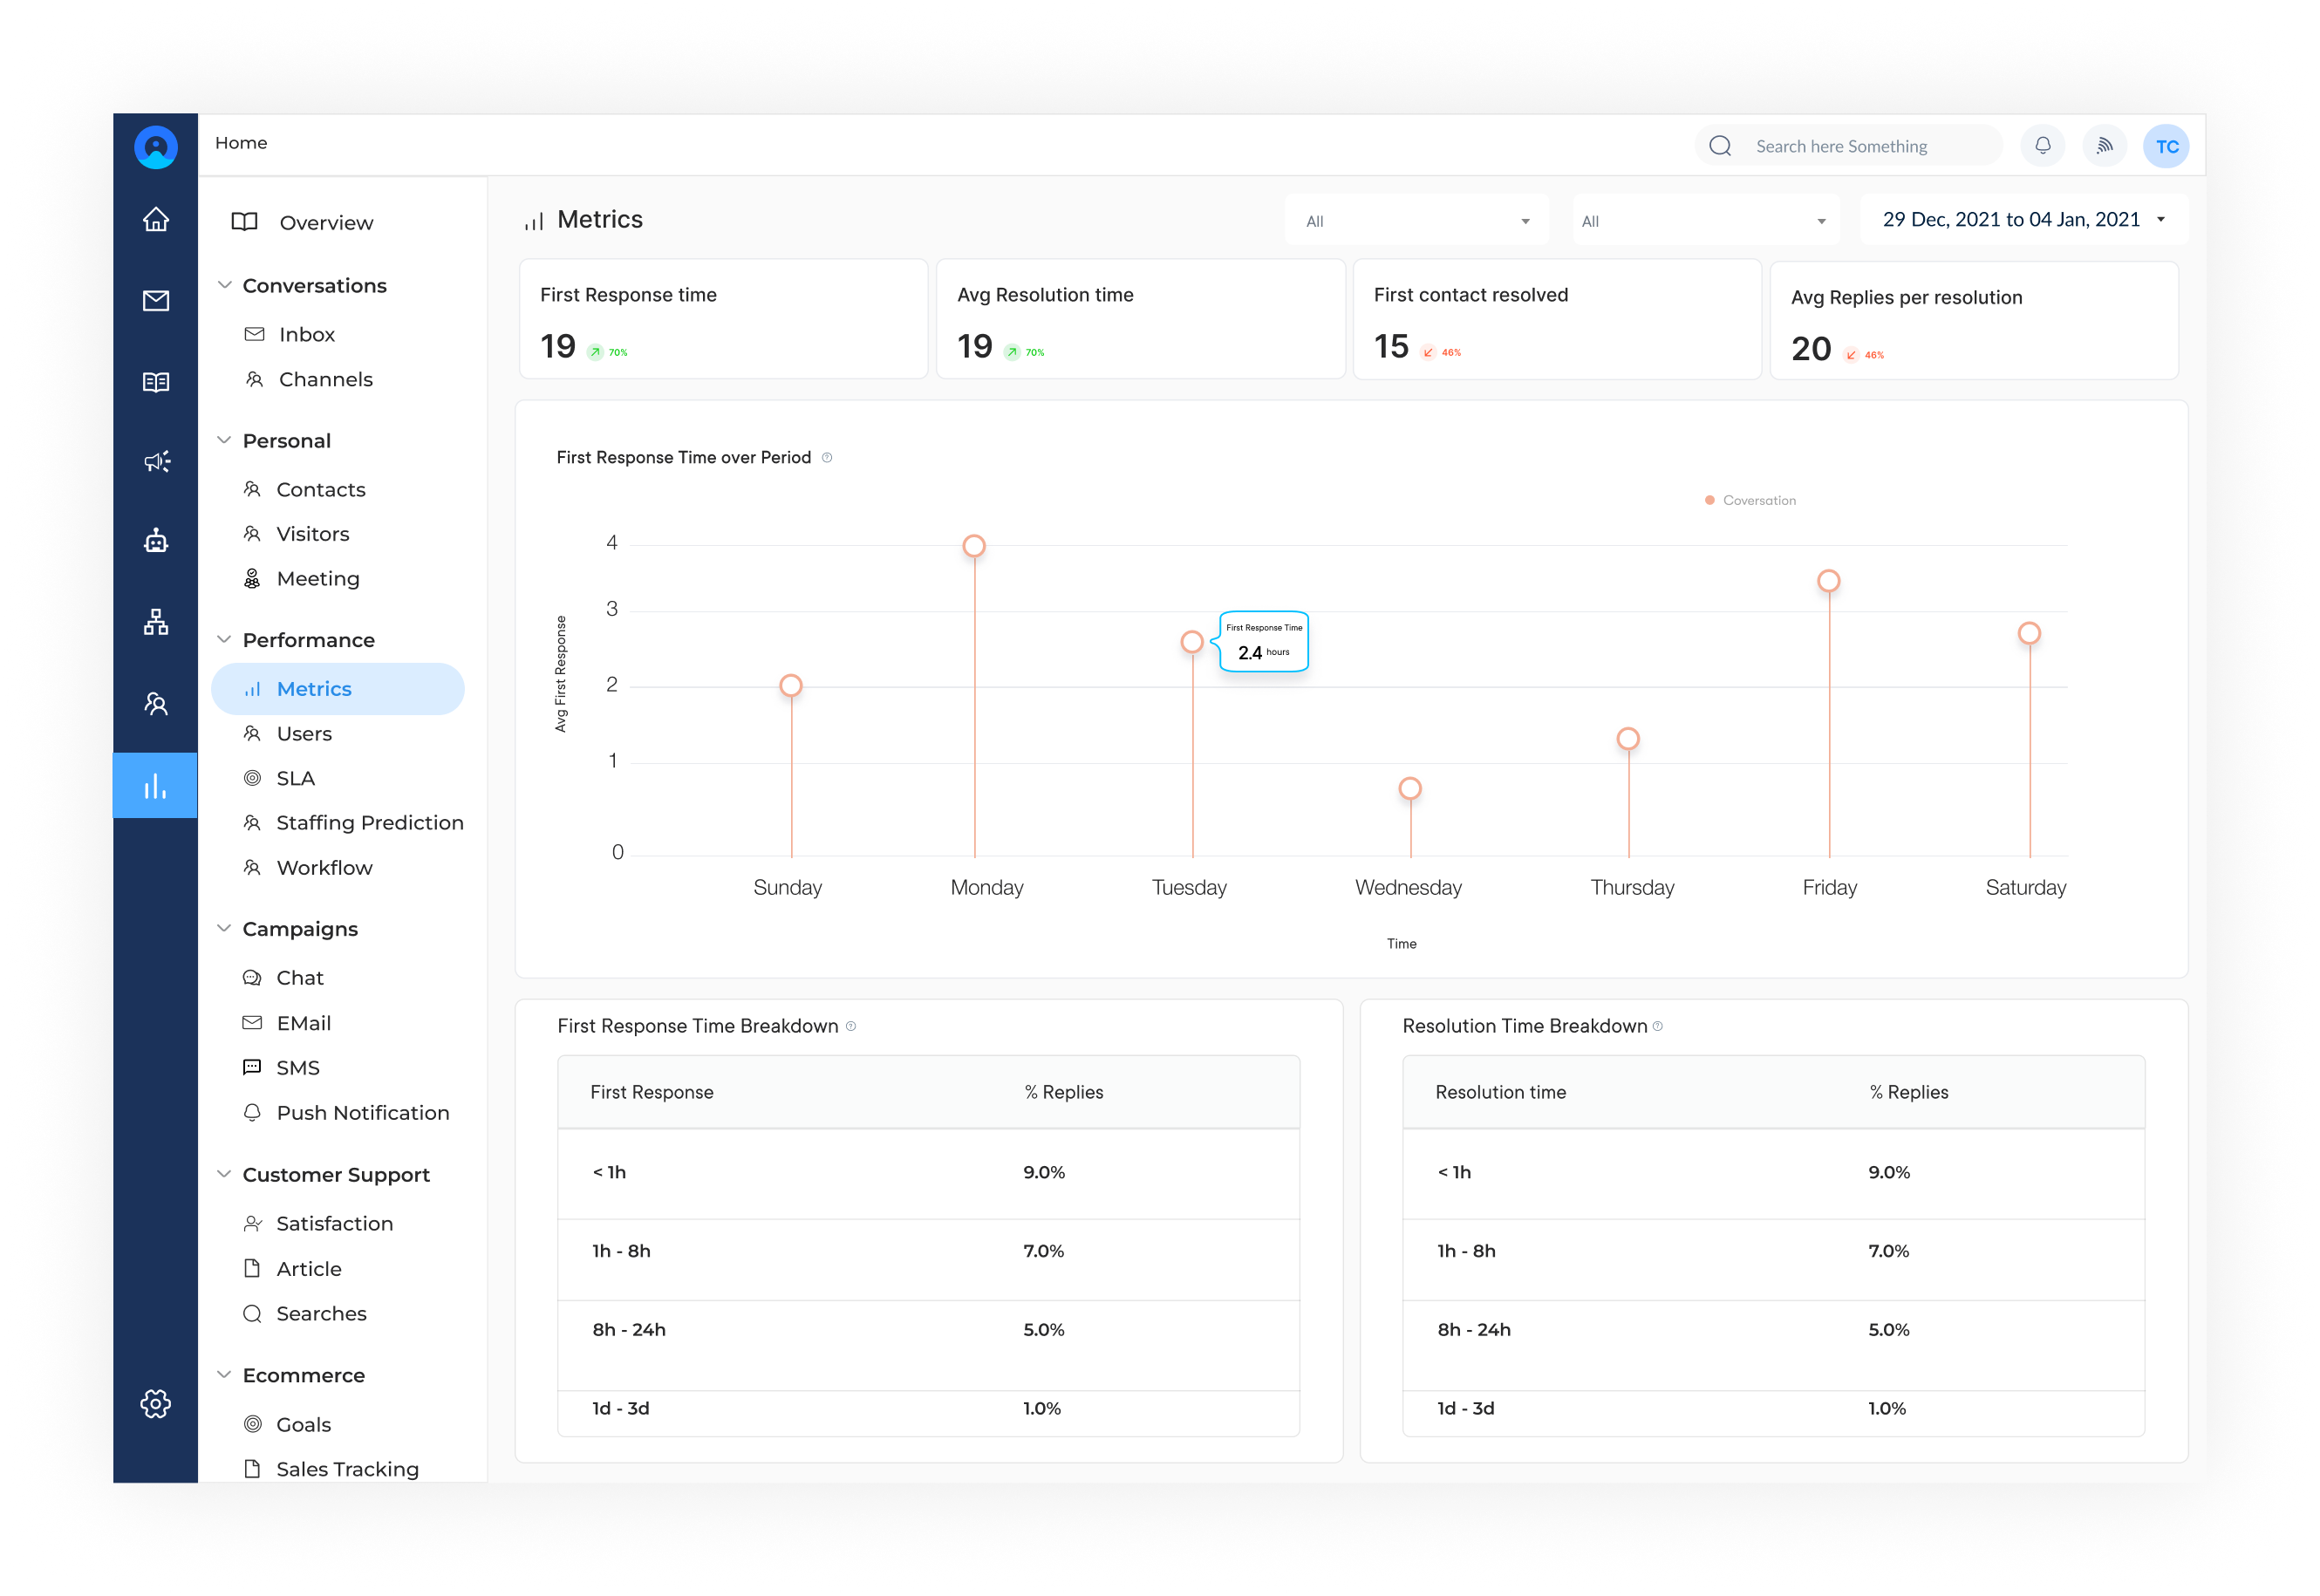
Omni24 is a powerful customer engagement software that can be used to measure customer success metrics. The software is designed to help businesses communicate with their customers effectively and efficiently, ultimately leading to improved customer satisfaction as well as retention.
key features:
Pricing: They offer a range of plans from a basic free plan to Enterprise level plans starting at $29/month. Higher tier plans include additional features such as access analytics, reporting as well as integrations into many leading platforms like Salesforce, Zapier, Hubspot etc., for SMBs and larger ones too!
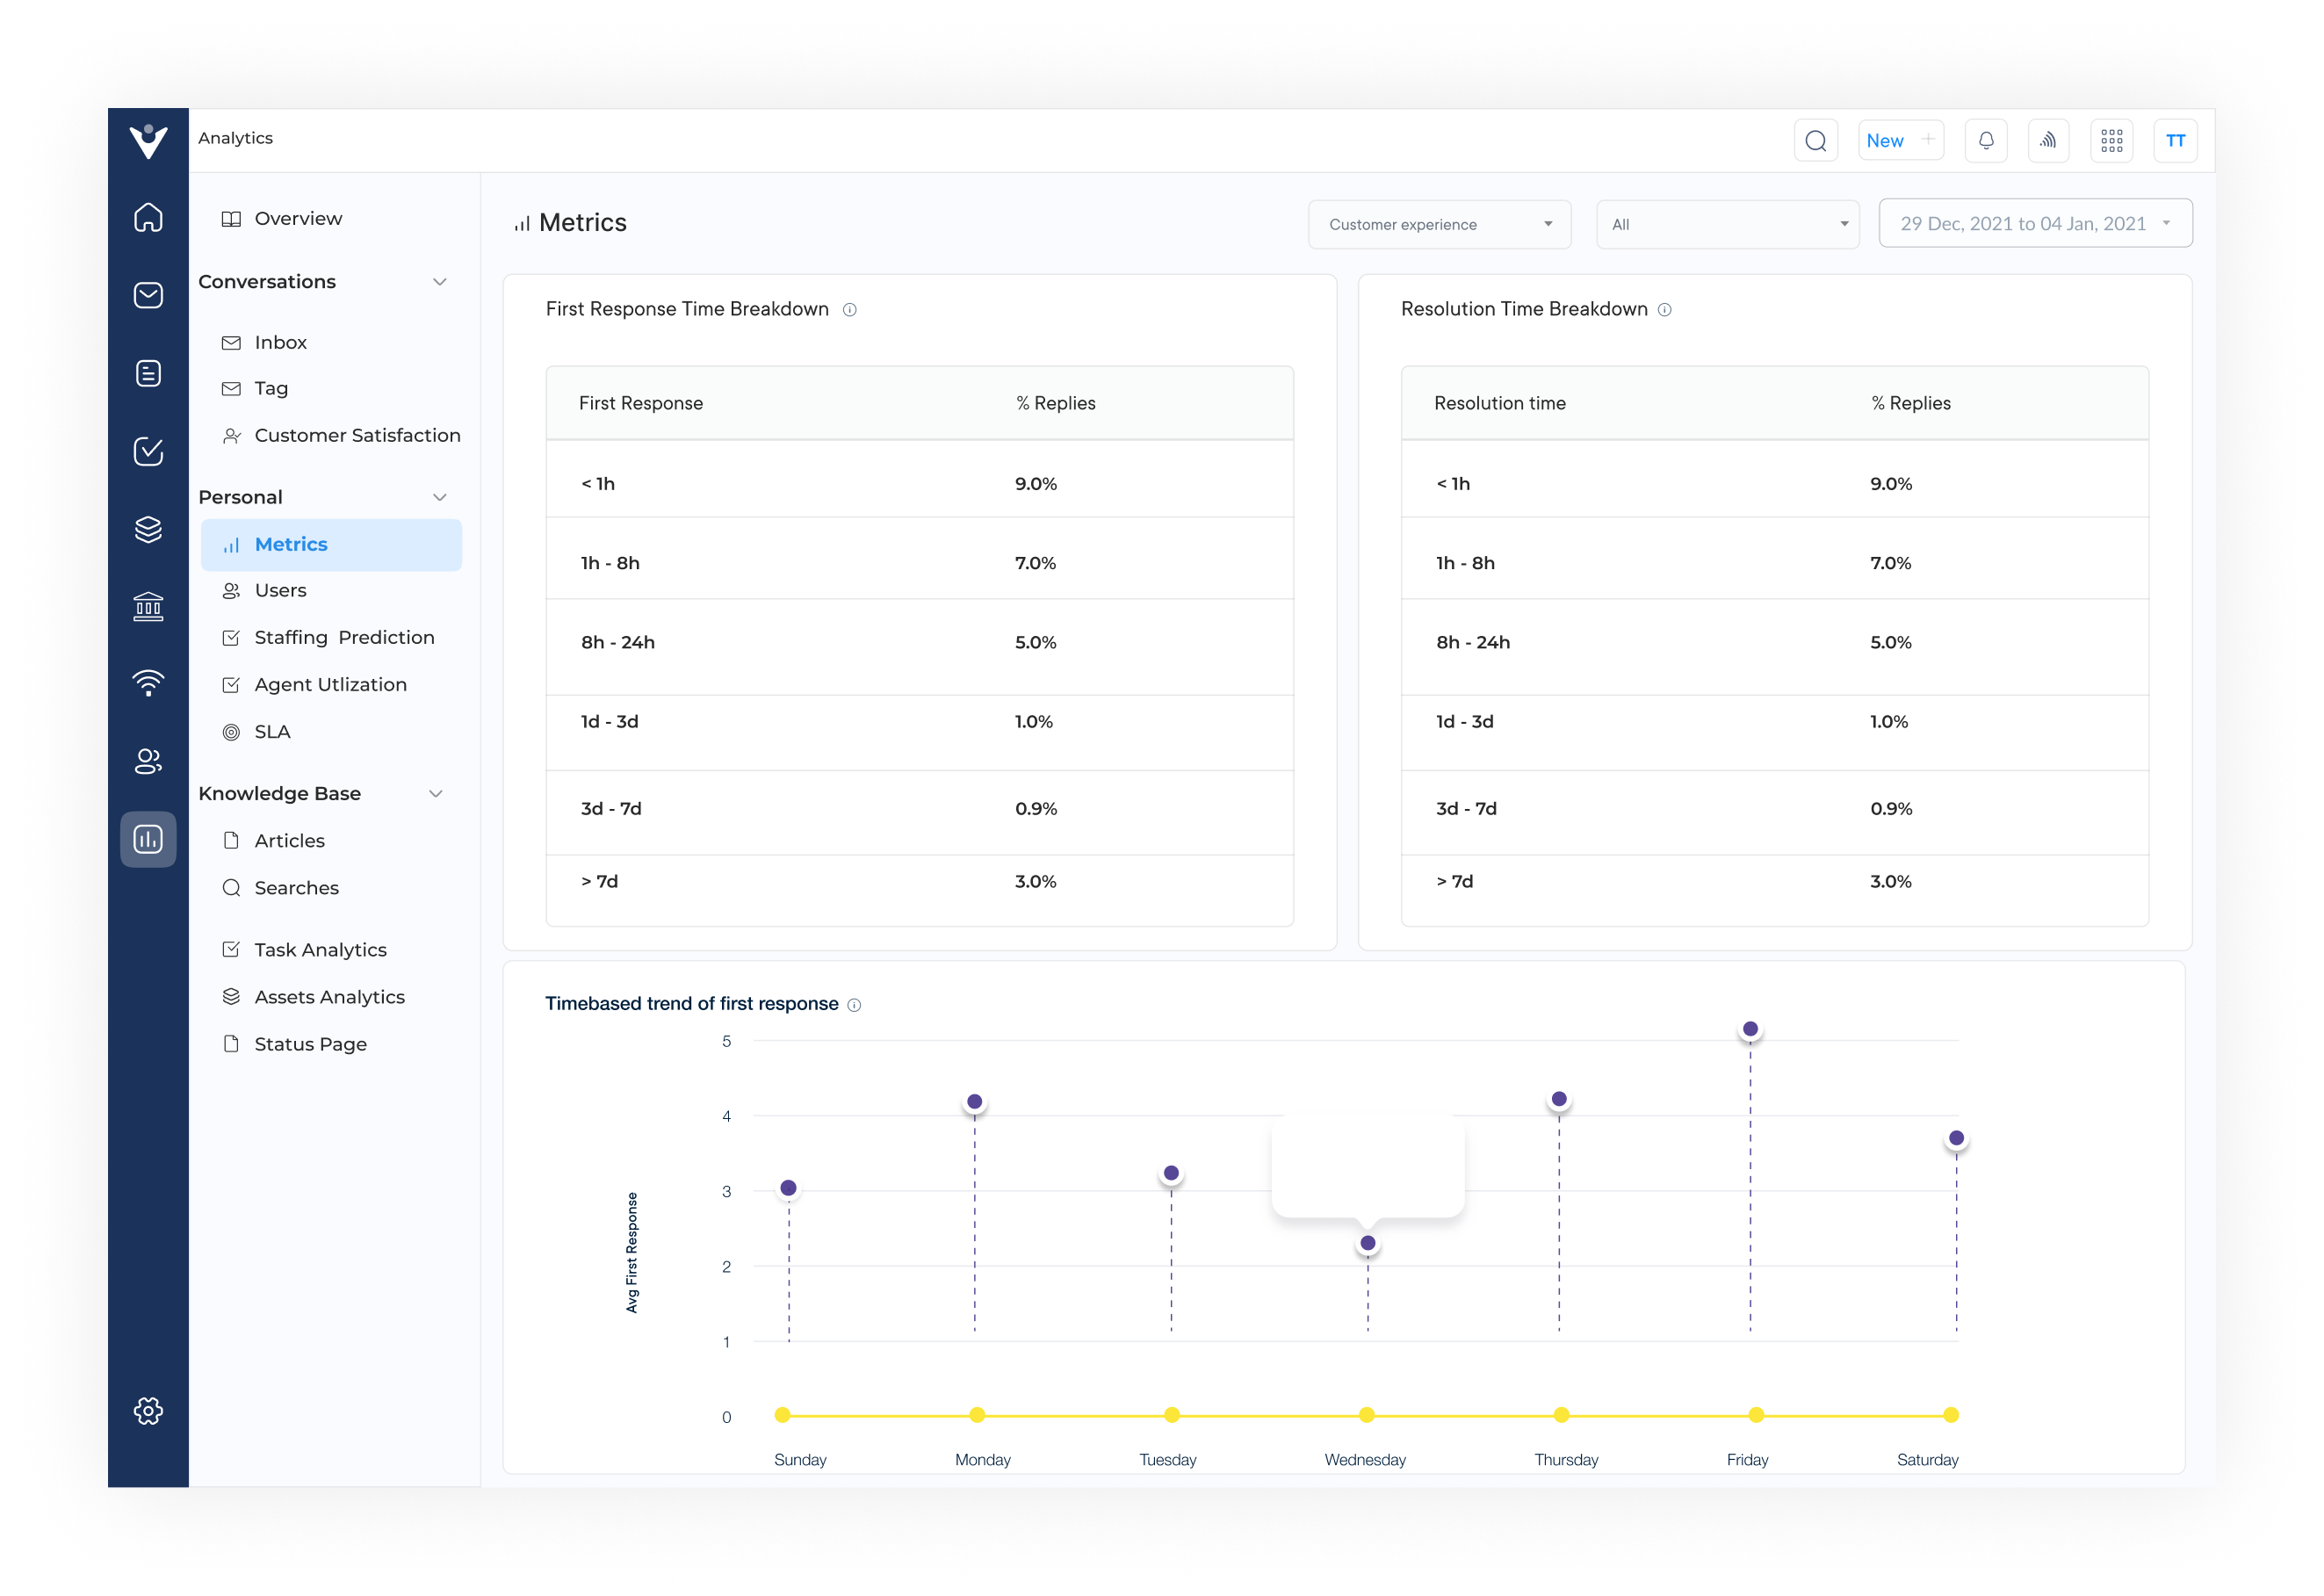
Veemo is a customer service software that can be used to measure customer success metrics. It offers a wide array of features to help businesses track and analyze customer interactions, ultimately leading to improved customer satisfaction as well as loyalty.
Key features:
Pricing: There are three pricing tiers based on the number of staff users, so companies can choose whichever works best for them – ranging from $19-299/month depending on the size of your business. Additional add-ons are included in a few packages at different costs, if necessary.
HubSpot is a comprehensive marketing software that offers a variety of tools for tracking customer success metrics. With HubSpot, you can track metrics such as customer satisfaction scores, customer lifetime value and customer retention rates. The software also provides detailed analytics and reporting features that help you understand how your marketing efforts are impacting customer success.
Salesforce is a popular CRM software that offers robust tools for measuring customer success metrics. Here you get to track metrics such as customer acquisition costs, customer retention rates and customer engagement levels. The software also provides customizable dashboards and reports that make it easy to analyze as well as interpret data related to customer success.
Customer success metrics dashboards provide real-time data and insights into customer behavior, engagement, satisfaction etc. It also allows companies to make informed decisions and take proactive steps to ensure their customers have a positive experience. Here are the real-life examples of companies that are using customer success metrics dashboards to drive success:
Amazon, utilizes customer success metrics dashboards to track customer satisfaction and loyalty. It monitors metrics such as order completion rates, customer feedback scores and product reviews, to identify areas for improvement while implementing strategies to enhance the CX.
Shopify, an e-commerce platform for online stores, leverages customer success metrics dashboards to track customer satisfaction and retention. By monitoring metrics such as order value, customer lifetime value and repeat purchase rates, Shopify is able to identify opportunities to improve the customer experience as well as drive business growth.
Cloud storage and file sharing service, Dropbox uses customer success metrics dashboards to track customer engagement. It analyzes metrics such as active users, file storage capacity and customer referrals to seek opportunities to enhance customer loyalty.
Airbnb uses customer success metrics dashboards to track customer feedback and satisfaction. Metrics such as guest reviews, host ratings, booking conversion rates, etc. helps the company find trends and patterns in customer behavior as well as make data-driven decisions.
Customer success metrics are crucial for businesses looking to ensure customer satisfaction, loyalty and retention. By tracking key metrics, companies can gain valuable insights into the success of their customer relationships. These metrics not only help businesses measure the effectiveness of their customer success strategies but also identify areas for improvement and opportunities for growth. It is important for businesses to regularly monitor and analyze customer success metrics to understand the impact of their efforts on customer satisfaction
Overall, customer success metrics play a vital role in shaping the customer experience and building long-lasting relationships with customers. Prioritize measurement as well as evaluation of these metrics to succeed in the competitive market landscape and drive sustainable growth in the long term.
Why are customer success metrics important for business?
Customer success metrics are crucial for businesses because they provide valuable insights into how well a company is meeting the needs and expectations of its customers. By tracking customer success metrics, businesses can identify areas for improvement, measure the impact of customer success initiatives, ultimately drive growth and profitability.
What is the most important metric for customer success?
One of the most important metrics for customer success is the Net Promoter Score (NPS). NPS measures the likelihood of customers to recommend a company’s products or services to others. A high NPS indicates that customers are satisfied with their experience and are likely to become loyal advocates for the brand. Other key metrics for customer success include customer satisfaction scores, retention rates, customer lifetime value and churn rates.
How can I measure the effectiveness of customer success?
To measure the effectiveness of customer success, businesses can track a combination of quantitative and qualitative metrics. Quantitative metrics, such as NPS, customer satisfaction scores and retention rates, provide numerical data that can be easily analyzed as well as compared over time. Qualitative metrics, such as customer feedback and testimonials, offer valuable insights into the customer experience while helping businesses understand how to improve their products.