Help Desk Metrics & KPIs: Measure Your Support Performance

Customer service is a vital element of business processes that can impact your bottom line and affect how your company is viewed in the public eye. So, it becomes crucial to measure help desk metrics and KPIs.

Help Desk Metrics & KPIs

Did you know that 70% of consumers say that they choose companies that deliver great customer service?

Where modern businesses are very much aware of the fact that providing a positive experience dramatically impacts business growth, managing a service desk can be a challenging task.

How do you ensure that your team is performing efficiently and meeting customer needs? By identifying the right set of help desk metrics and KPIs, you can measure customer service satisfaction.

A well-functioning service desk is crucial for providing timely and effective support to customers. You need a comprehensive dashboard that provides real-time data on various metrics to optimize your help desk performance.

What is The Help Desk Metrics Dashboard?

A help desk metrics dashboard is defined as a visual representation of key performance indicators (KPIs) and metrics related to the help desk’s performance. It provides real-time data, allowing supervisors to monitor the efficiency of the support operations.

The dashboard collects data from various sources, such as ticketing systems and customer surveys, to provide a comprehensive overview of the service desk’s performance. Its main objective is to provide actionable insights and enable data-driven decision-making to improve performance as well as customer satisfaction.

Why are Service Desk KPIs and Metrics Important to Business?

Businesses make data-driven decisions to improve their overall operations by using valuable insight provided by key performance indicators and metrics.

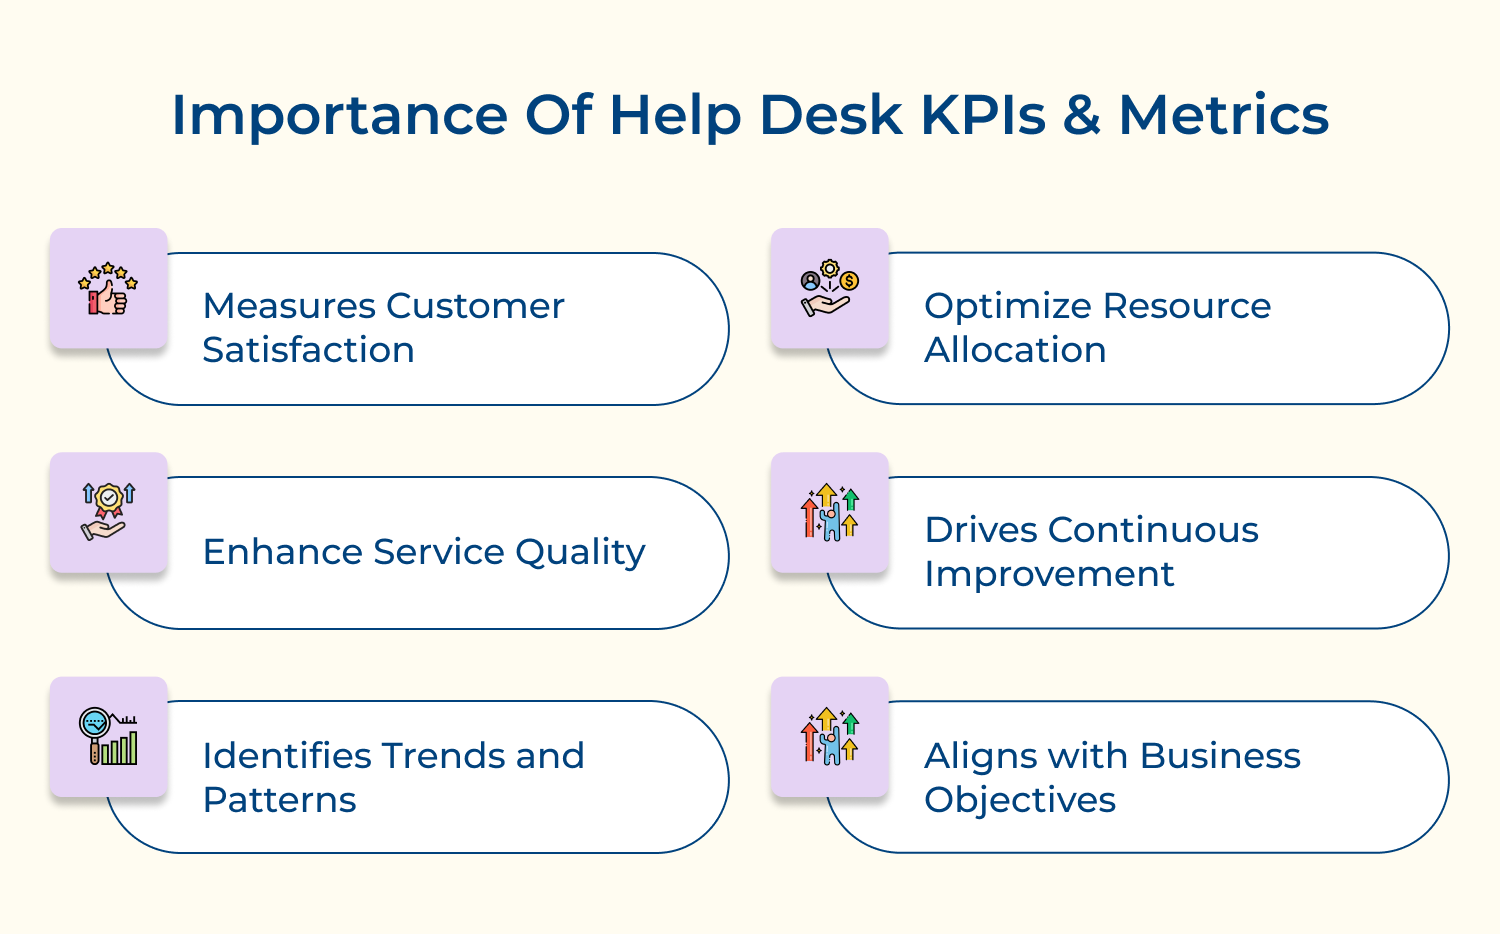
Service Desk KPIs and Metrics Importance

Here are the benefits of service desk KPIs and metrics to businesses:

  • Measures Customer Satisfaction

Tracking KPIs such as CSAT scores or Net Promoter Scores (NPS), helps you gauge how well your service desk is meeting customer expectations. These metrics provide insights into customer sentiment and help identify areas for improvement.

  • Enhances Service Quality

Service desk metrics like First Call Resolution (FCR) and Average Resolution Time (ART) help businesses assess the efficiency of their service desk. By monitoring these metrics, businesses can identify bottlenecks, train their staff and improve overall service quality.

  • Identifies Trends and Patterns

Businesses can identify patterns in customer inquiries by analyzing service desk metrics. For example, a sudden increase in specific types of tickets indicates a recurring issue that needs to be addressed. The proactive approach allows businesses to make informed decisions.

  • Optimizes Resource Allocation

Service desk metrics like ticket volume, average handle time or agent utilization provide valuable data that helps businesses optimize resource allocation. It allows businesses to allocate resources effectively, reduce costs, and improve productivity.

  • Drives Continuous Improvement

Help desk metrics & KPIs create a feedback loop that drives continuous improvement. By regularly reviewing the metrics, businesses can identify areas for improvement, set targets and track progress over time.

  • Aligns with Business Objectives

Help desk KPIs provide a tangible way to measure the success of the service desk function and align it with broader business objectives. By setting specific KPIs that are directly linked to overall goals, businesses ensure that their service desk is contributing to their success.

How to Measure the Success of a Help Desk?

Measuring the performance of your live chat metrics allows you to understand how well your customer service team is performing.

Help desk Success Measurement

Let’s explore the key metrics you should consider when measuring the performance of the help desk.

1. First Response Time (FRT)

Delay in the response time might result in customers leaving your website. 59% of customers are likely to buy when brands answer their queries in under a minute.

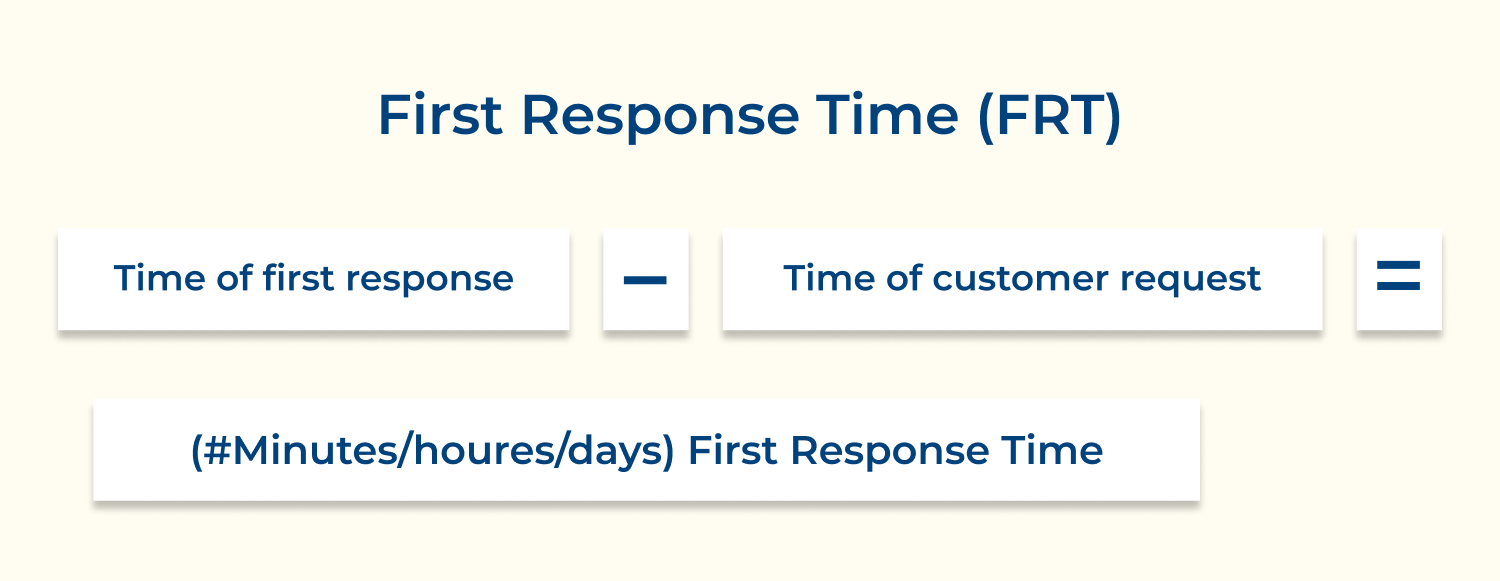
First Response Time refers to the average time a customer service representative takes to respond to a customer’s initial contact. It is a crucial metric as it measures the speed of service delivery and sets the tone for the entire customer interaction.

A prompt response can leave a positive impression on customers, showing that their concerns are being addressed promptly.

First Response Time (FRT)

Steps to measure it:

  • Determine the starting point: Decide the time for measuring FRT. For example, it could begin when a customer submits their request via email, chat, or phone call.
  • Track response times: Implement a system that tracks the time between customer requests and the initial response from the customer service team. It will help you accurately measure FRT.
  • Calculate the average: Add all response times and divide the sum by the total number of responses. It will give you an accurate representation of your FRT.

2. Customer Satisfaction Score (CSAT)

Customer Satisfaction Score is a metric that directly measures the satisfaction levels of customers. It is usually obtained through post-interaction surveys or feedback ratings.

CSAT helps businesses gauge how well their customer service efforts meet customer expectations. They can also identify areas that need improvement and implement strategies to enhance customer satisfaction.

Customer Satisfaction Score (CSAT)

Steps to measure it:

  • Set up a survey: Design a survey tailored to measure customer satisfaction. The survey can include questions regarding the customer’s overall experience, the quality of support received, and their likelihood to recommend your business to others.
  • Gather feedback: Distribute the survey to customers who have interacted with your customer service team. It can be done through email, website pop-ups, or follow-up phone calls.
  • Analyze responses: Once you have collected enough responses, calculate the CSAT by dividing the number of satisfied customers by the total number of respondents and multiplying by 100. It will give you a CSAT percentage.

3. First Contact Resolution (FCR)

First Contact Resolution measures the percentage of customer issues that are resolved during the initial contact with customer support. 60% of companies that measure FCR for 1+ year report a 1 to 30% improvement in their performance.

FCR reflects the ability of customer service representatives to address customer problems effectively without the need for additional follow-up or escalations.

First Contact Resolution (FCR)

A high FCR indicates efficient problem-solving skills, reduces customer effort and improves overall customer experience.

Steps to measure it:

  • Define the FCR metric: Clearly define what constitutes a resolved issue in the first contact. Determine if partial resolution or temporary fixes count towards FCR or if only complete resolutions are considered.
  • Gather data: Track customer interactions across various channels, such as calls, emails, live chat, or social media and collect relevant information like ticket logs, call logs, or chat transcripts.
  • Identify first contacts: Analyze the data to identify customer interactions that are considered first contacts. For example, if a customer contacts support multiple times for the same issue, only the first contact should be counted.
  • Determine resolution status: Assess each first contact and identify whether the issue was fully resolved or if the customer required additional interactions for complete resolution.
  • Calculate FCR rate: Divide the number of first contacts with complete resolutions by the total number of first contacts and multiply by 100 to get the FCR rate as a percentage.

4. Tickets Opened

Tickets Opened is a key Help desk service metric that refers to the number of customer inquiries, support requests, or issues raised by customers through various channels such as email, chat or social media.

Measuring the metric helps businesses understand customer demand and identify trends in customer concerns.

Steps to measure it:

  • Define a time frame: Decide on the time frame within which you want to measure the tickets opened. It could be a day, week, or month.
  • Track ticket creation: Record the number of new tickets or issues that are created within the defined time frame.
  • Analyze trends: Monitor and analyze the ticket creation pattern over time to identify any fluctuations or recurring issues.
  • Measure the volume: Calculate the total number of tickets opened during the defined time frame.

5. Tickets Closed

Once customer inquiries or issues have been addressed and resolved, it is crucial to measure the Tickets Closed metric. It reflects the effectiveness of the support team and
can help evaluate customer satisfaction.

Tickets Closed

Steps to measure it:

  • Record ticket closure data: Maintain a record or ticketing system that tracks the status of support tickets. Keep track of the tickets opened and closed during a specified period.
  • Calculate closure rate: Divide the number of tickets closed by the total number of tickets opened. Multiply the result by 100 to get the closure rate as a percentage.
  • Analyze closure time: Measure the average time it takes for a ticket to be closed. It will help you identify any bottlenecks in your support process that may be causing delays.

6. Escalation Rate

The Escalation Rate service desk metric measures the percentage of support tickets that are escalated to higher levels of authority or expertise within the organization.
A high escalation rate may indicate a need for additional training or a knowledge gap within the support team. It is crucial to monitor the metric to identify areas for improvement and ensure that customer concerns are effectively addressed without unnecessary escalations.

Steps to measure it:

  • Define the escalation criteria: Establish clear criteria for when a customer issue should be escalated. It could be based on the complexity of the problem, the need for specialized knowledge, or if the customer’s issue remains unresolved after a certain period.
  • Track escalations: Implement a system or software that allows you to track customer issues and record when they are escalated to a higher level of support or management.
  • Calculate the rate: Divide the number of escalated issues by the total number of customer issues handled during a specific period, typically a week or a month. Multiply the result by 100 to get the escalation rate as a percentage.

7. Self-Service Utilization

Self-Service utilization is an important help desk KPI that measures the percentage of customers who utilize self-service options, such as FAQs, knowledge bases, or online forums, to find solutions to their problems without contacting customer support.

A higher self-service utilization rate indicates that customers are finding the information they need independently, reducing the need for direct support and improving efficiency.

Steps to measure it:

  • Monitor self-service channels: Keep track of the number of customers accessing your self-service resources. It can be achieved by integrating analytics tools into your website or self-service portal.
  • Calculate utilization rate: Divide the number of customers who utilized self-service options by the total number of support inquiries during a specific period. Multiply the result by 100 to get the utilization rate as a percentage.
  • Analyze customer satisfaction: Conduct surveys or collect feedback to gauge customer satisfaction with your self-service resources. It will help you identify any gaps or areas for improvement.

8. Abandoned Calls/Chats

Abandoned Calls/Chats refer to customer interactions that are terminated by the customer before the issue is resolved or the conversation is completed. The metric helps identify instances where customers are dissatisfied with the support received or are unable to resolve.

Steps to measure it:

  • Set up a tracking system: Implement a call center tracking system or use call center software that allows you to collect data on abandoned calls or chats. The system should enable you to gather information like time, date and reason for abandonment.
  • Determine the time frame: Decide on a specific time frame in which you want to measure abandoned calls or chats. It could be daily, weekly, or monthly, depending on the needs of your call center.
  • Calculate the abandonment rate: To measure the abandonment rate, divide the number of abandoned calls/chats by the total number of calls/chats received during the chosen time frame. Multiply the result by 100 to get the percentage.

9. Agent Productivity

Agent Productivity measures the efficiency and effectiveness of the support team or agents in handling customer inquiries. Measuring the metric helps organizations identify high-performing agents, areas for improvement and training needs.

Steps to measure it:

  • Define productivity metrics: Determine the key performance indicators (KPIs) you want to measure, such as average call handling time, number of calls handled, customer satisfaction ratings, or conversion rates. These metrics will depend on the specific goals and objectives of your call center.
  • Collect individual agent data: Record individual agent performance data, including the number of calls handled, talk time, hold time, after-call work time and any other relevant metrics. The data can be obtained from your call center software or tracking system.
  • Calculate productivity metrics: Using the data collected, calculate the chosen productivity metrics for each agent. It will give you an overview of individual performance and allow you to compare agents based on their productivity levels.

Role of KPI and Metrics in Improving Help Desk Support

Businesses heavily rely on their help desk support teams to provide timely and effective solutions to various customer issues.

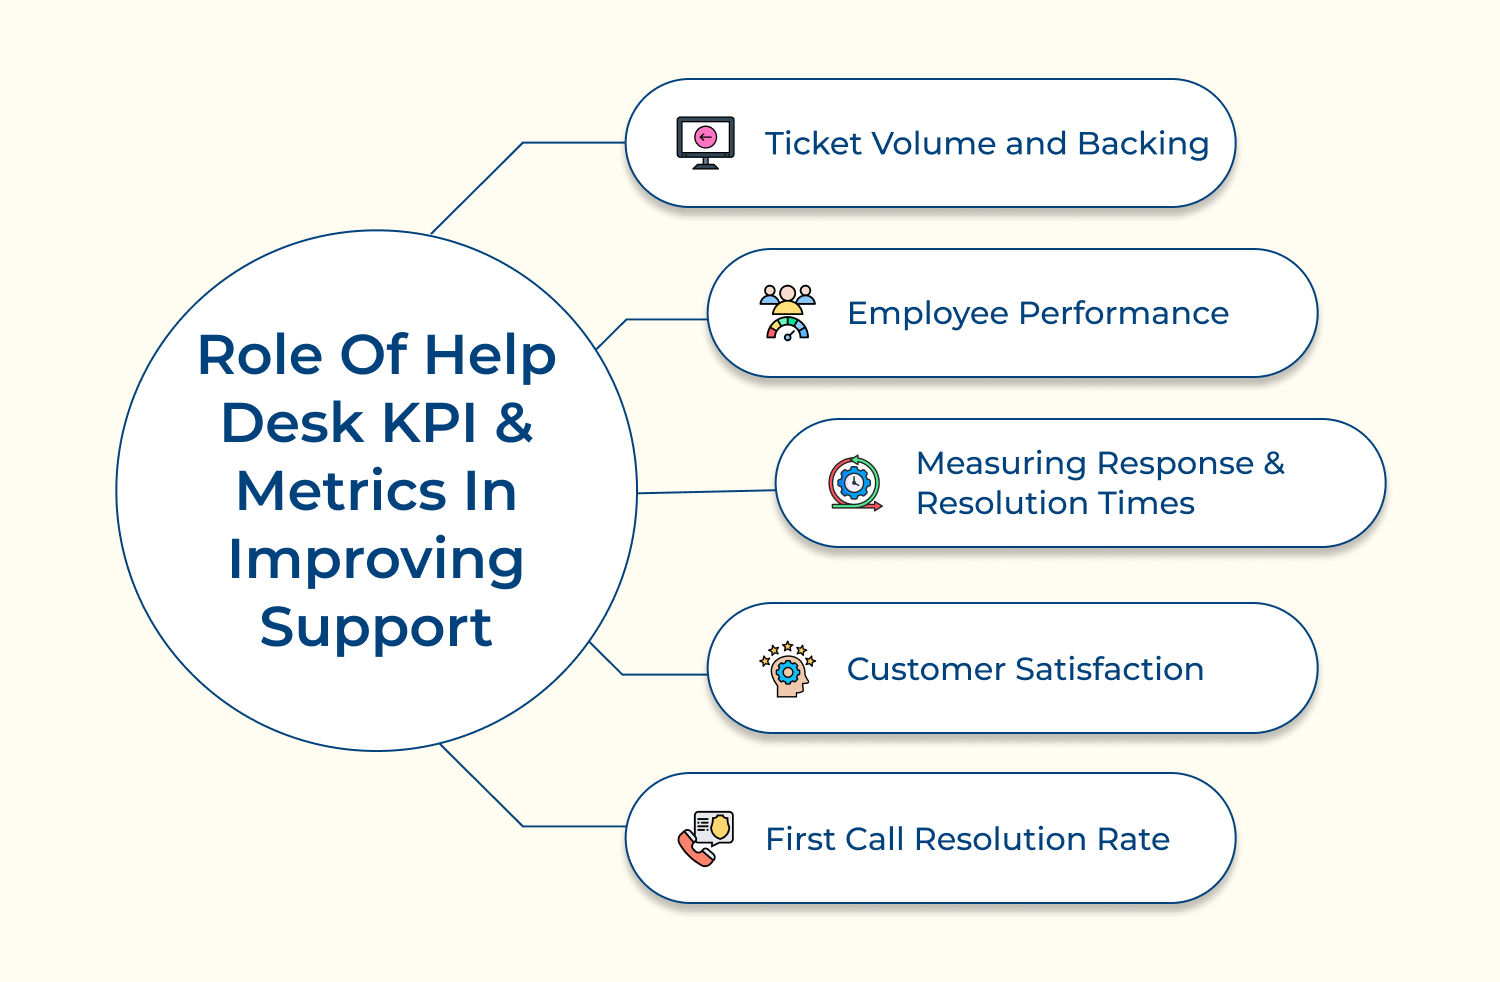
Help Desk Support KPI & Metrics

Let’s delve into the key role played by KPIs and metrics in improving support:

Measuring Response & Resolution Times

These primary KPIs in help desk support quantify how quickly support agents acknowledge customer inquiries and resolve their issues. By monitoring these KPIs, businesses can identify bottlenecks or areas where improvements can be made to reduce wait times and enhance customer satisfaction.

First Call Resolution Rate

The FCR rate is an important metric for help desk support evaluations. It measures the percentage of customer issues that are resolved in a single interaction. A high first-call resolution rate indicates that the support team is equipped with the knowledge and resources to address customer problems effectively.

Customer Satisfaction

Customer satisfaction is a key metric that gauges the level of customer loyalty towards the support services provided. Businesses can measure customer satisfaction via surveys or feedback forms. By monitoring CSAT scores, support teams can implement strategies to enhance the quality of service.

Ticket Volume and Backlog

Ticket volume is a key help desk KPI that represents the number of support inquiries received and the number of unresolved issues awaiting resolution. Businesses can ensure that their support teams are adequately staffed to handle the incoming volume of requests. Reducing ticket backlog helps in providing faster responses thereby improving their experience.

Employee performance

Help desk KPIs and metrics also play a significant role in evaluating the performance of individual support agents or the entire team. Businesses can identify top performers as well as provide targeted training to improve the skills of underperforming agents by assessing metrics like average handling time, customer satisfaction scores and ticket resolution rates.

Examples of Best Help Desk Metrics and KPIs Software

Help desk metrics & KPIs improve efficiency and allow businesses to assess the performance of service.
Here is the best software that enables brands to provide exceptional support.

1. Omni24

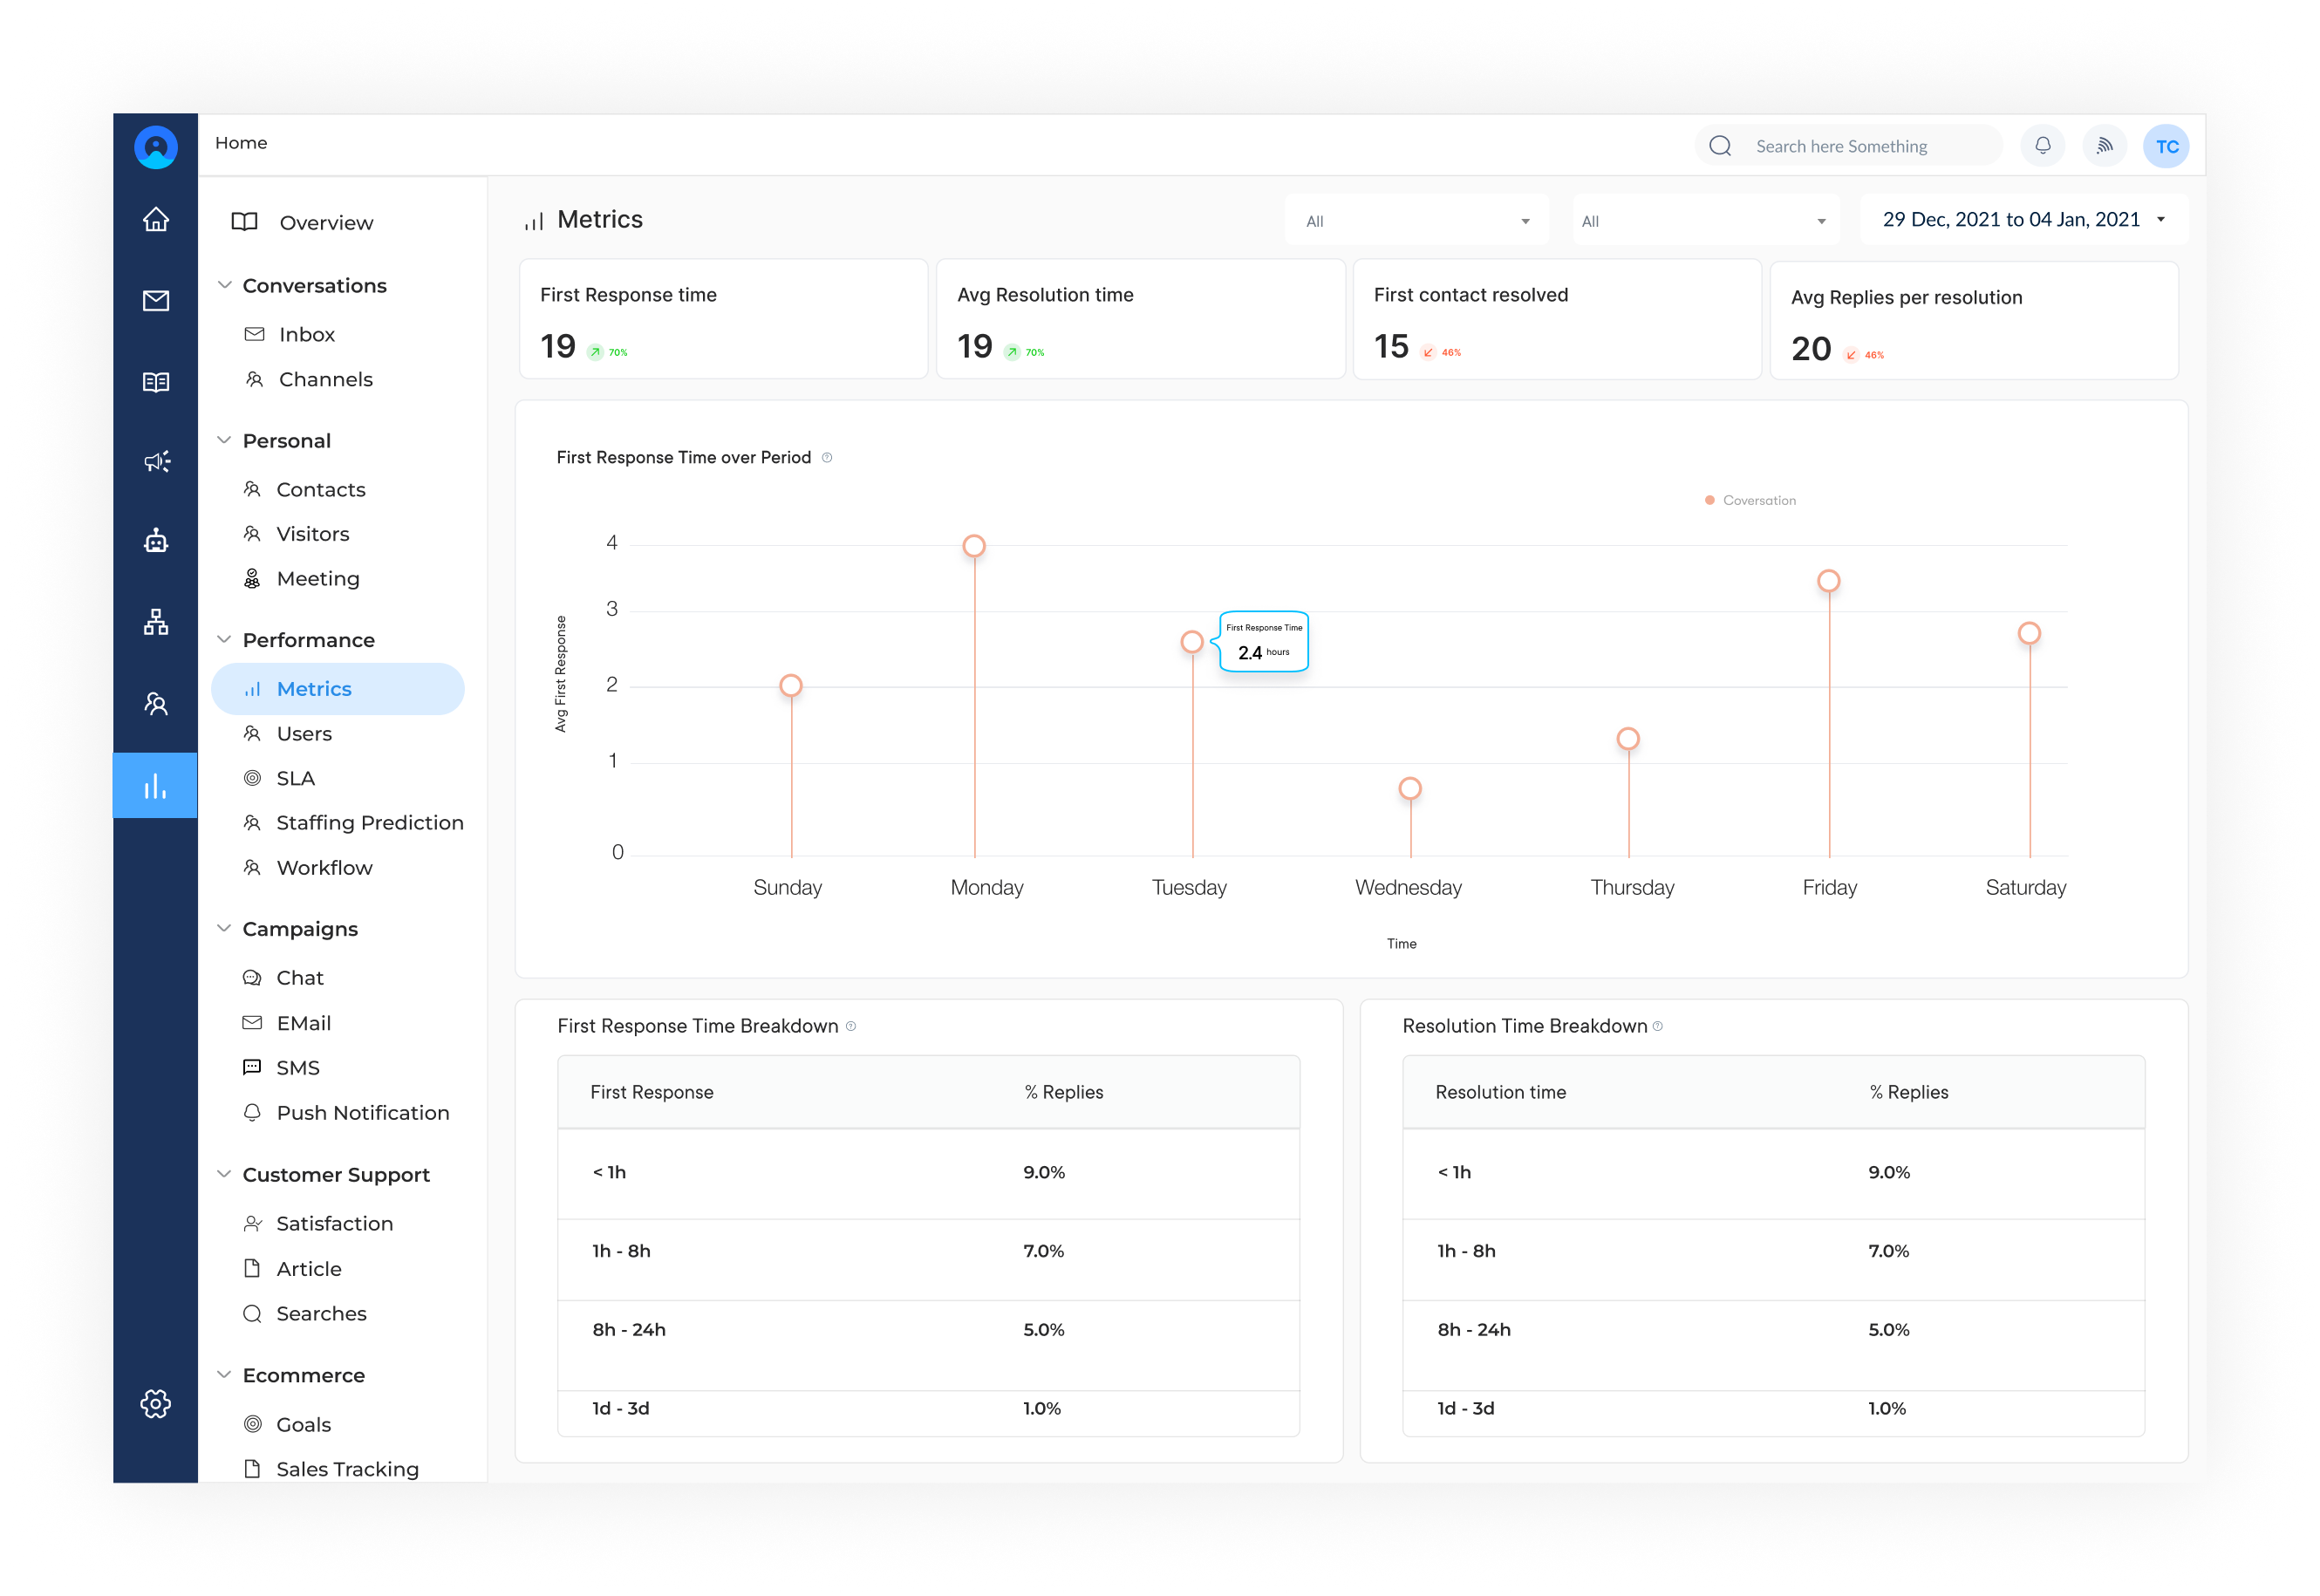
Omni Report Metrics

Omni24 is a robust help desk software that offers a comprehensive KPI dashboard. It provides real-time data on ticket volume, response times, customer satisfaction, agent performance, and more.
The intuitive interface allows for easy customization, giving you the flexibility to track the specific KPIs that matter most to your business. With detailed reports & analytics, Omni24 enables organizations to optimize their support operations and enhance customer experience.
Key features:

  • Customer history: It aggregates customer data from multiple channels, providing a complete view of customer interactions and order information.
  • Customizable notifications: Agents receive notifications for new inquiries, ensuring timely responses and minimizing customer wait time.
  • Performance analytics: It provides performance analytics or reports, helping teams track key metrics and identify areas for improvement.

Pricing: Omni24 offers flexible pricing options based on the number of agents and channels. The basic plan starts at $29 per user per month, while the enterprise plan is custom-priced based on specific business needs. Businesses can also opt for a free trial before committing to the software.

2. Veemo

Metrics

Veemo is another top-rated help desk software that includes a powerful KPI dashboard. It offers a wide range of metrics or analytics to monitor agent productivity, customer feedback, and ticket resolution rates.
The customizable dashboard allows you to visualize data in charts, graphs, and widgets based on your preferences. With Veemo, you can easily identify areas that need improvement and streamline your support operations.
Key features:

  • Agent workload: Measure the number of open tickets assigned to each agent. It helps ensure your support staff is not overwhelmed and can effectively handle customer inquiries.
  • Conversation volume: Monitor the number of conversations taking place within your help desk platform. It provides insights into the workload and helps you allocate resources effectively.
  • Customer effort score (CES): Assess how much effort customers have to put in to resolve their issues. It measures the ease of the support process from the customer’s perspective.

Pricing: Veemo offers a range of pricing plans to suit businesses of all sizes, ranging from $29 per month per user for up to $149 per month per user including advanced features such as automation, integrations, and custom branding. The software also offers a 14-day free trial for businesses to test the features before committing to a paid plan.

3. Help Crunch

Help Crunch is a customer communication platform that incorporates a KPI dashboard to track key metrics related to customer support. It provides insights into response times, resolution rates, customer feedback, and agent performance. Help Crunch also offers a live chat feature, which allows support teams to communicate with customers in real time.
Key features: The KPI dashboard provides a holistic view of your help desk operations, helping you to optimize efficiency and deliver exceptional customer service.

4. Gorgias

Gorgias is a help desk software designed specifically for e-commerce businesses. Its KPI dashboard offers insights into metrics such as response times, customer satisfaction, agent performance, and ticket status. Gorgias integrates seamlessly with popular e-commerce platforms like Shopify, Magento, and WooCommerce, allowing for efficient management of customer inquiries.
Key features: The software’s automation capabilities help streamline repetitive tasks, enabling your team to focus on more complex customer issues.

5. Gladly

Gladly is a customer service platform that provides a comprehensive KPI dashboard to help track and measure customer support metrics. It offers insights into response times, customer satisfaction scores, agent productivity, and customer communication history. Its unified view of customer interactions across various channels ensures smooth and personalized support experiences.
Key features: The KPI dashboard enables teams to identify trends, identify bottlenecks, and make data-driven decisions to enhance customer service.

Provide Quality Support by Utilizing Help Desk Metrics and KPI

KPIs and metrics are instrumental in driving improvements in help desk support. By tracking these indicators, organizations can gain valuable insights into the effectiveness of their support processes and make data-driven decisions.

Continuously monitoring and striving to improve these metrics can lead to enhanced customer satisfaction, streamlined support processes, as well as a more effective service desk team. Whether you are a small business or a large organization, implementing a help desk metrics dashboard can streamline your support operations and enhance customer satisfaction.

FAQs about Service Desk Metrics & KPIs

Several key help desk metrics and KPIs are tracked to evaluate the performance of the help desk. These include first response time, average resolution time, customer satisfaction rating, ticket escalation rate and customer retention rate. Each of these metrics provides valuable data points that can be used to assess the efficiency and effectiveness of the support.

Help desk metrics and KPIs can serve as valuable tools in improving customer satisfaction. By analyzing these metrics, service desk managers can identify areas that require improvement and take necessary actions. For example, if the first response time is high, it may indicate the need for additional staff or improved ticket routing procedures. By addressing these issues, help desks can ensure quicker response times, leading to increased customer satisfaction.

Establishing benchmarks or goals for help desk metrics and KPIs is essential for monitoring as well as improving performance. Without these benchmarks, it becomes challenging to identify whether the service desk is performing at its optimum level or not. By setting realistic goals, help desk managers can motivate their teams to strive for excellence and continuously improve their performance.

Customer feedback and surveys play a vital role in measuring service desk performance. They provide firsthand insights into the customers’ experience, allowing help desk managers to understand their pain points and areas requiring improvement. By integrating customer feedback into support metrics as well as KPIs, businesses can further refine their support processes and ensure that they meet customer expectations.

blog sidebar image

Quickstart Guides

Popular

Latest Blogs