Transform Insights into Actions with Customer Experience (CX) Metrics

Customer experience metrics or KPIs measure how easy, enjoyable and useful customers find their experience with your business across the entire customer journey. Measuring and optimizing for improved customer experience results in increased customer loyalty and customer satisfaction.

Customer Experience Metrics

Delivering exceptional customer experience isn’t just a nice-to-have—it’s a must in a hyper-competitive business landscape.

But how do you know if your efforts are truly hitting the mark?

Enter customer experience (CX) metrics and KPIs: the secret weapons of customer-centric business. These are powerful tools that offer a window into your customers’ hearts and minds, transforming raw data into actionable insights.

61% of consumers will pay at least 5% more if they know they’ll get a good customer experience.

Whether you are a CX pro or just starting your journey, understanding these benchmarks can be the difference between merely satisfying customers and creating loyal fans.

Ready to unlock the full potential of your CX strategy? Let’s dive into the metrics that matter most.

What are Customer Experience (CX) Metrics?

Customer experience (CX) metrics & key performance indicators (KPIs) refer to quantifiable measures used to evaluate the quality of interactions between a company and its customers. They provide insights into customer satisfaction, loyalty and overall experience with a brand’s products/services.
CX Metrics help businesses understand customer perceptions, identify areas for improvement, and gauge the effectiveness of their customer-centric initiatives. By analyzing the metrics, businesses can make data-driven decisions to enhance their customer experience strategies.

Key objectives:

  • Measure customer satisfaction by identifying pain points and areas of excellence in the customer journey
  • Drive customer loyalty by tracking metrics that indicate long-term customer relationships and repeat business
  • Inform business decisions by providing actionable insights into customer preferences, behaviors and expectations

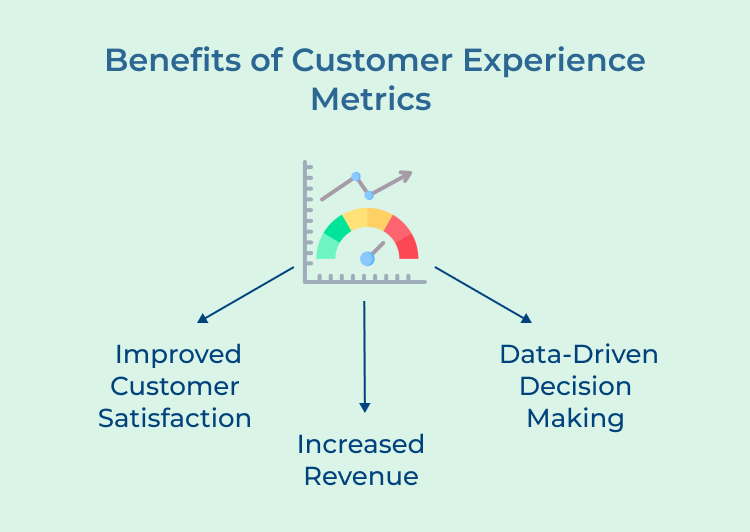
Key Benefits of Customer Experience Metrics & KPIs

65% of leaders have increased their focus on metrics for agent productivity and retention. Customer experience metrics and KPIs offer a lot of advantages for businesses seeking to enhance their customer-centric approach.

Customer Experience Metrics Benefits
  • Faster issue resolution: CX metrics help identify common customer pain points and recurring issues quickly. By tracking metrics, businesses can pinpoint gaps in their support process. It allows implementing targeted solutions leading to faster resolution and increased customer satisfaction.
  • Streamlined processes: Analyzing key metrics and KPIs helps businesses to identify inefficiencies in their customer journey. They highlight areas where customers struggle, allowing them to streamline processes, resulting in a smoother and more intuitive customer experience.
  • Higher customer lifetime value: CX metrics like Net Promoter Score (NPS) and Customer Satisfaction (CSAT) are directly linked to customer loyalty. By improving these scores, businesses can increase retention and encourage repeat purchases, which contributes to a higher customer lifetime value.
  • Reduced customer churn: Regularly monitoring metrics & KPIs helps businesses identify at-risk customers before they churn. It allows for proactive intervention, such as personalized outreach or special offers, to re-engage these customers and prevent them from leaving.
  • Operational efficiency: Customer experience metrics empower businesses to identify inefficiencies in their customer service operations. The valuable insights can guide process improvements, technology investments and staff training, leading to more efficient operations.
  • Better resource allocation for CX initiatives: CX metrics help prioritize improvement efforts by highlighting the areas that have the most significant impact on customer satisfaction. The data-driven approach ensures that CX investments are targeted where they can deliver the most value, maximizing the ROI.

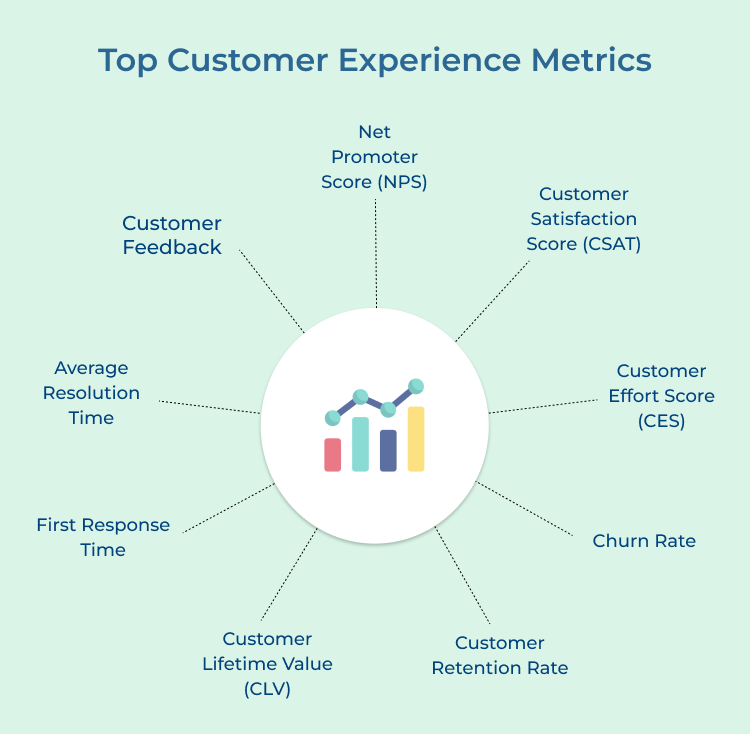
9 Popular Customer Experience(CX) Metrics and KPIs

Customer experience metrics & KPIs help businesses monitor and analyze customer relations by considering their overall journey.

Top Customer Experience Metrics

1. Net Promoter Score (NPS)

NPS measures customer loyalty and likelihood of recommending a company’s products or services to others. It provides insights into overall customer satisfaction and the potential for word-of-mouth marketing, helping businesses gauge their reputation.

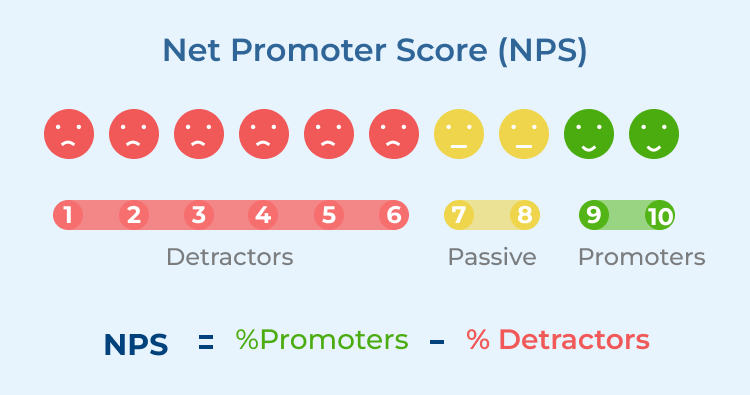
Net Promoter Score

To calculate NPS, ask customers, “On a scale of 0-10, How likely are you to recommend our company?”
Respondents to an NPS question are grouped into three categories based on their ratings:

  • Promoters (score 9-10): Loyal customers who will keep purchasing and will refer the business to others.
  • Passives (score 7-8): Satisfied customers but they may be swayed by competitive offerings.
  • Detractors (score 0-6): Unhappy customers who can damage your brand by negative word-of-mouth.

To complete the calculation, take % of promoters (9’s & 10’s) and subtract the % of detractors (0’s through 6’s), leaving out the passives (7’s & 8’s).

The formula is: NPS = % Promoters – % Detractors.

NPS helps improve CX by identifying loyal customers and those at risk of churning. Businesses can address issues causing low scores and leverage promoters for testimonials, enhancing overall customer satisfaction.

2. Customer Satisfaction Score (CSAT)

CSAT measures how satisfied customers are with a specific product, service, or interaction. It provides immediate feedback on customer experiences, allowing businesses to quickly identify and address pain points in their customer journey.

The CSAT metric helps pinpointing specific areas of satisfaction or dissatisfaction. Businesses can use the data to make targeted improvements, enhance products or services and train staff to better meet customer needs.

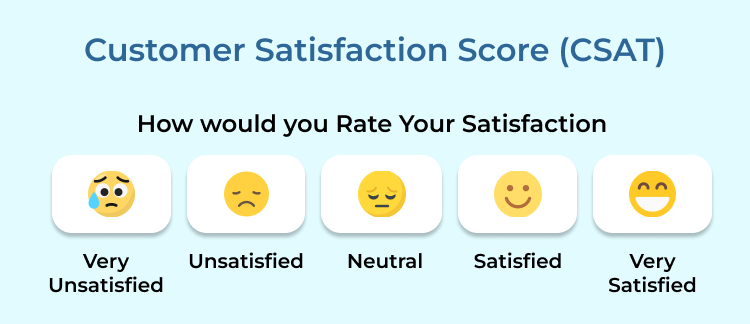
Customer Satisfaction Score (CSAT)

You can calculate CSAT by asking, “How satisfied were you with your experience?” on a scale (e.g., 1-5). Sum the positive responses and divide by total responses.

The formula is: CSAT = (Number of satisfied customers / Total number of survey responses) x 100.

For example, if 80 out of 100 customers say they are satisfied with your product, the CSAT score would be 80%.

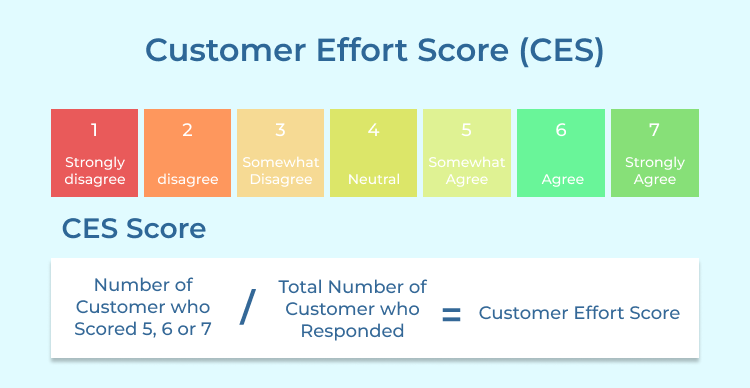
3. Customer Effort Score (CES)

CES measures how much effort customers expend to complete a task or resolve an issue. It indicates the ease of doing business with a company and highlights areas where customer interactions can be simplified or streamlined.

The CES metric is an important CX metric that helps identify friction points in customer interactions. By reducing their effort, businesses can enhance satisfaction. It creates more efficient processes that benefit both customers and the business.

Customer Effort Score (CES)

To calculate CES, ask customers to rate their agreement with the statement: “The company made it easy to handle my issue.” Use a scale (e.g., 1-7). Formula: CES = Sum of all scores / Number of respondents.

4. Customer Churn Rate

Customer churn rate measures the percentage of clients who stop doing business over a specific period. It indicates customer retention and loyalty, highlighting potential issues in product quality, customer service or overall experience.

The churn rate metric helps improve CX by analyzing key reasons for churn, businesses can address underlying issues, improve retention strategies and enhance overall customer satisfaction.
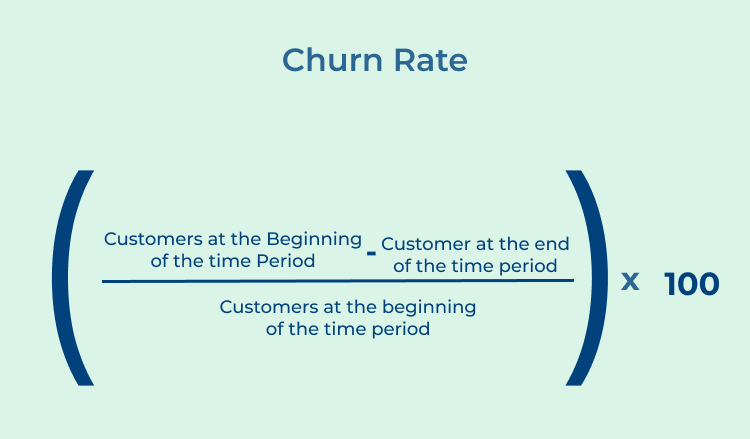
You can calculate churn rate by dividing the number of customers lost during a period by the total number of customers at the start of that period.

Churn Rate

The formula is: Churn Rate = (Customers lost / Total customers at start) x 100.

For example: At the beginning of the month, you had 500 customers. During the month, 20 customers stopped using your service.

Customer Churn Rate = (20/500) x 100 = 4%

5. Customer Lifetime Value (CLV)

The customer lifetime value metric estimates the total revenue a business can expect from a single customer account throughout their relationship.

The key CX metric encourages businesses to focus on long-term customer relationships. It guides investment in customer retention programs leading to enhanced experiences and increased customer value over time.

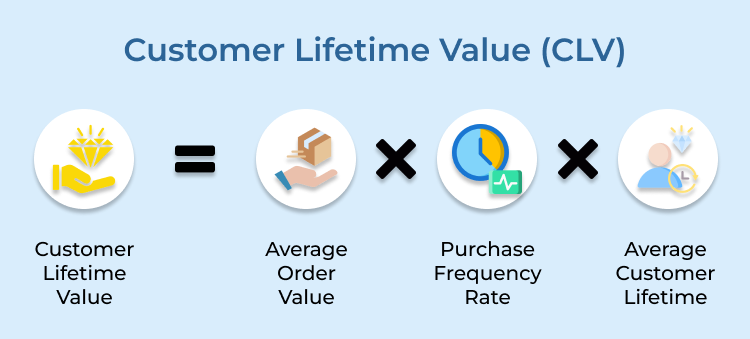
Customer Lifetime Value (CLV)

You can calculate CLV by multiplying the average purchase value by the average purchase frequency rate and the average customer lifespan.

The formula is: CLV = Average Purchase Value x Average Purchase Frequency Rate x Average Customer Lifespan.

6. First Response Time (FRT)

FRT measures the average time it takes for a company to provide an initial response to a customer inquiry or support request. It indicates a company’s responsiveness and efficiency in addressing customer needs.

Calculate FRT by summing the time between initial customer contact and first response for all requests, then dividing by the total number of requests.

First Response Time

Formula: FRT = Total time to first response / Number of requests.

FRT helps improve CX by identifying delays in customer support. Reducing response times can increase customer satisfaction, build trust and demonstrate a company’s commitment to prompt.

7. Customer Retention Rate

Customer retention rate measures the percentage of customers a company retains over a specific period. It indicates customer loyalty and the effectiveness of retention strategies, providing insights into overall customer satisfaction.
The CX metric focuses on keeping existing customers satisfied. High retention rates indicate effective CX strategies, while low rates signal areas for improvement in products, services or customer relationships.
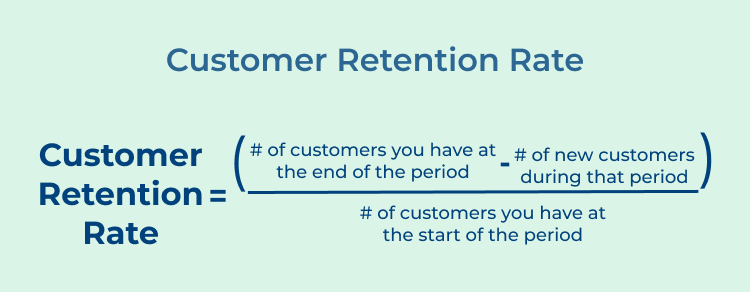
You can calculate retention rate by subtracting new customers acquired from total customers at period end, dividing by customers at start and multiplying by 100.

Customer Retention Rate

The formula is: Retention Rate = ((Customers at End – New Customers) / Customers at Start) x 100.
For example: At the beginning of the month, you had 500 customers. During the month, you acquired 50 new customers and at the end of the month, you had 480 customers.

Customer Retention Rate = ((480-50)/500) x 100 = 86%

8. Average Resolution Time (ART)

ART measures the average time it takes to resolve a customer issue or request from start to finish. It provides insights into the efficiency and effectiveness of a company’s customer support processes.
The average resolution rate metric identifies the gaps in issue resolution. Reducing resolution times can increase customer satisfaction, build trust and demonstrate a company’s commitment to efficient problem-solving or support.

Average Resolution Time (ART)

You can calculate ART by summing the total time taken to resolve all issues and dividing by the number of resolved issues.

The formula: ART = Total time to resolve all issues / Number of resolved issues.

9. Customer Health Score

Customer Health Score is a composite metric that assesses the overall strength and potential of a customer relationship. It combines various indicators such as product usage, customer engagement, support tickets and financial metrics to provide a holistic view.

Customer Health Score

The calculation varies by company but typically involves assigning weights to different factors and combining them into a single score.

A simple formula might be: Health Score = (Usage Score x 0.3) + (Engagement Score x 0.3) + (Support Score x 0.2) + (Financial Score x 0.2)

The Customer Health Score KPI helps identify at-risk customers and opportunities for growth, enabling proactive measures to improve customer experience & strengthen relationships before issues arise.

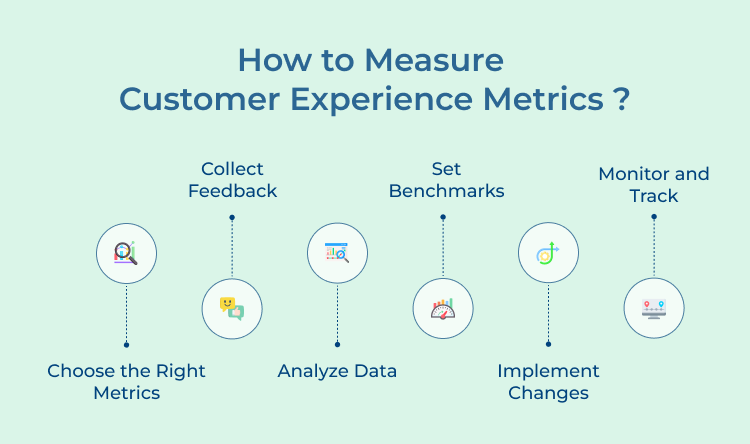
7 Steps to Measure B2B Customer Experience Metrics

Measuring customer experience metrics is crucial for any business looking to improve their overall customer satisfaction and loyalty.

How to Measure Customer Experience Metrics

1. Identify Key Touchpoints

Mapping out the customer journey is crucial for understanding where and how customers interact with your brand. Identify all significant touchpoints, from initial awareness to post-purchase support, to ensure you’re measuring the most impactful moments in the customer experience.

Best practices:

  • Conduct customer journey mapping workshops with cross-functional teams
  • Use customer feedback to validate and refine touchpoint identification
  • Regularly update touchpoints as your business evolves and customer behavior changes

2. Choose Relevant Metrics

Select metrics that align with your business goals and provide meaningful insights into customer experience.

The common metrics include Net Promoter Score (NPS), Customer Satisfaction (CSAT), Customer Effort Score (CES) and retention rates. Ensure a mix of both quantitative and qualitative metrics.

Actionable tips:

  • Align metrics with specific business objectives and key performance indicators (KPIs)
  • Consider industry benchmarks and best practices when selecting metrics
  • Balance leading and lagging indicators to get a comprehensive view of customer experience

3. Implement Data Collection Methods

Establish robust systems for collecting customer feedback and experience data. It may include surveys, interviews, focus groups, social media monitoring and analysis of customer support interactions. Ensure data collection is consistent, timely and captures feedback across all relevant touchpoints.

Best practices:

  • Use a mix of collection methods to gather both structured and unstructured feedback
  • Implement real-time feedback collection at key moments in the customer journey
  • Ensure data collection methods are user-friendly and accessible across various channels

4. Analyze and Interpret Data

Once data is collected, analyze it to extract meaningful insights. Look for patterns, trends and correlations that can inform decision-making. Use advanced analytics techniques, such as sentiment analysis and text mining, to derive deeper insights from qualitative feedback.

Actionable Tips:

  • Utilize data visualization tools to make insights more accessible and actionable
  • Combine customer experience data with operational and financial metrics for context
  • Regularly conduct cross-functional analysis sessions to gain diverse perspectives on the data

5. Set Benchmarks and Goals

Establish baseline performance levels for your chosen metrics and set realistic improvement goals. Benchmarks can be based on historical performance, industry standards, or competitor analysis. Ensure goals are specific, measurable, achievable, relevant and time-bound (SMART).

Best practices:

  • Regularly review and adjust benchmarks based on changing market conditions as well as customer expectations
  • Set both short-term and long-term goals to maintain momentum & drive continuous improvement
  • Involve frontline employees in goal-setting to ensure buy-in and alignment across the organization

6. Implement Improvement Initiatives

Based on the insights gained from data analysis, develop and implement targeted initiatives to improve customer experience.

It may involve process changes, employee training, technology upgrades, or product enhancements. Prioritize initiatives based on their potential impact and feasibility.

Pro tips:

  • Create cross-functional teams to design and implement improvement initiatives
  • Use pilot programs to test initiatives before full-scale implementation
  • Develop a robust change management plan to ensure successful adoption of new initiatives

7. Monitor Progress and Iterate

Continuously track the performance of your customer experience metrics and the impact of improvement initiatives.

Regularly review progress against set goals and benchmarks. Be prepared to adjust your approach based on new insights and changing customer needs.

Best practices:

  • Implement a regular reporting cadence to keep stakeholders informed of progress
  • Conduct periodic reviews to assess the effectiveness of your measurement approach
  • Build a culture of continuous improvement by celebrating successes and learning from failures

Top Platforms to Measure Customer Experience Metrics

There are several software tools available that track and analyze these metrics effectively. Here are the top software tools that can be used to measure customer success metrics:

1. Omni24

Omni24 is an AI-powered omnichannel customer experience platform that centralizes all customer interactions. The platform focuses on improving people-centric experiences and empowers agents with efficient tools and support. Software helps businesses to streamline service operations, reduce response time and enhance overall client satisfaction.

Key features:

  • Omnichannel inbox: Centralizes customer interactions from multiple channels into a single interface. Enables agents to view and respond to messages from various platforms efficiently. Provides a unified customer history for personalized service.
  • Customer satisfaction surveys: Allows businesses to gather feedback on customer experiences through customizable surveys. Offers insights into service quality, agent performance and areas for improvement.
  • Reviews management: Facilitates the collection and management of customer reviews across different platforms. Enables businesses to monitor, respond to and analyze customer feedback in one place.
  • Live chat: Provides real-time communication between customers and support agents on websites or apps. Offers features like chat routing, canned responses and file sharing for efficient support.
  • Help desk: Centralizes customer support operations with ticket management and routing capabilities. Includes features like automated workflows, SLA tracking and internal collaboration tools.
  • Omnichannel ticketing: Consolidates customer inquiries from various channels into a unified ticketing system. Ensures consistent handling of customer issues regardless of the communication channel.
  • Knowledge base: Serves as a self-service portal for customers to find answers to common questions. Includes features like search functionality, categorization and article management.

Pricing: The pricing starts from $29/month/user. The pricing depends on factors like the number of users, the level of features required and the scale of customer support operations. Omni24 also offers a 14-day free trial for businesses to explore its features before making a commitment.

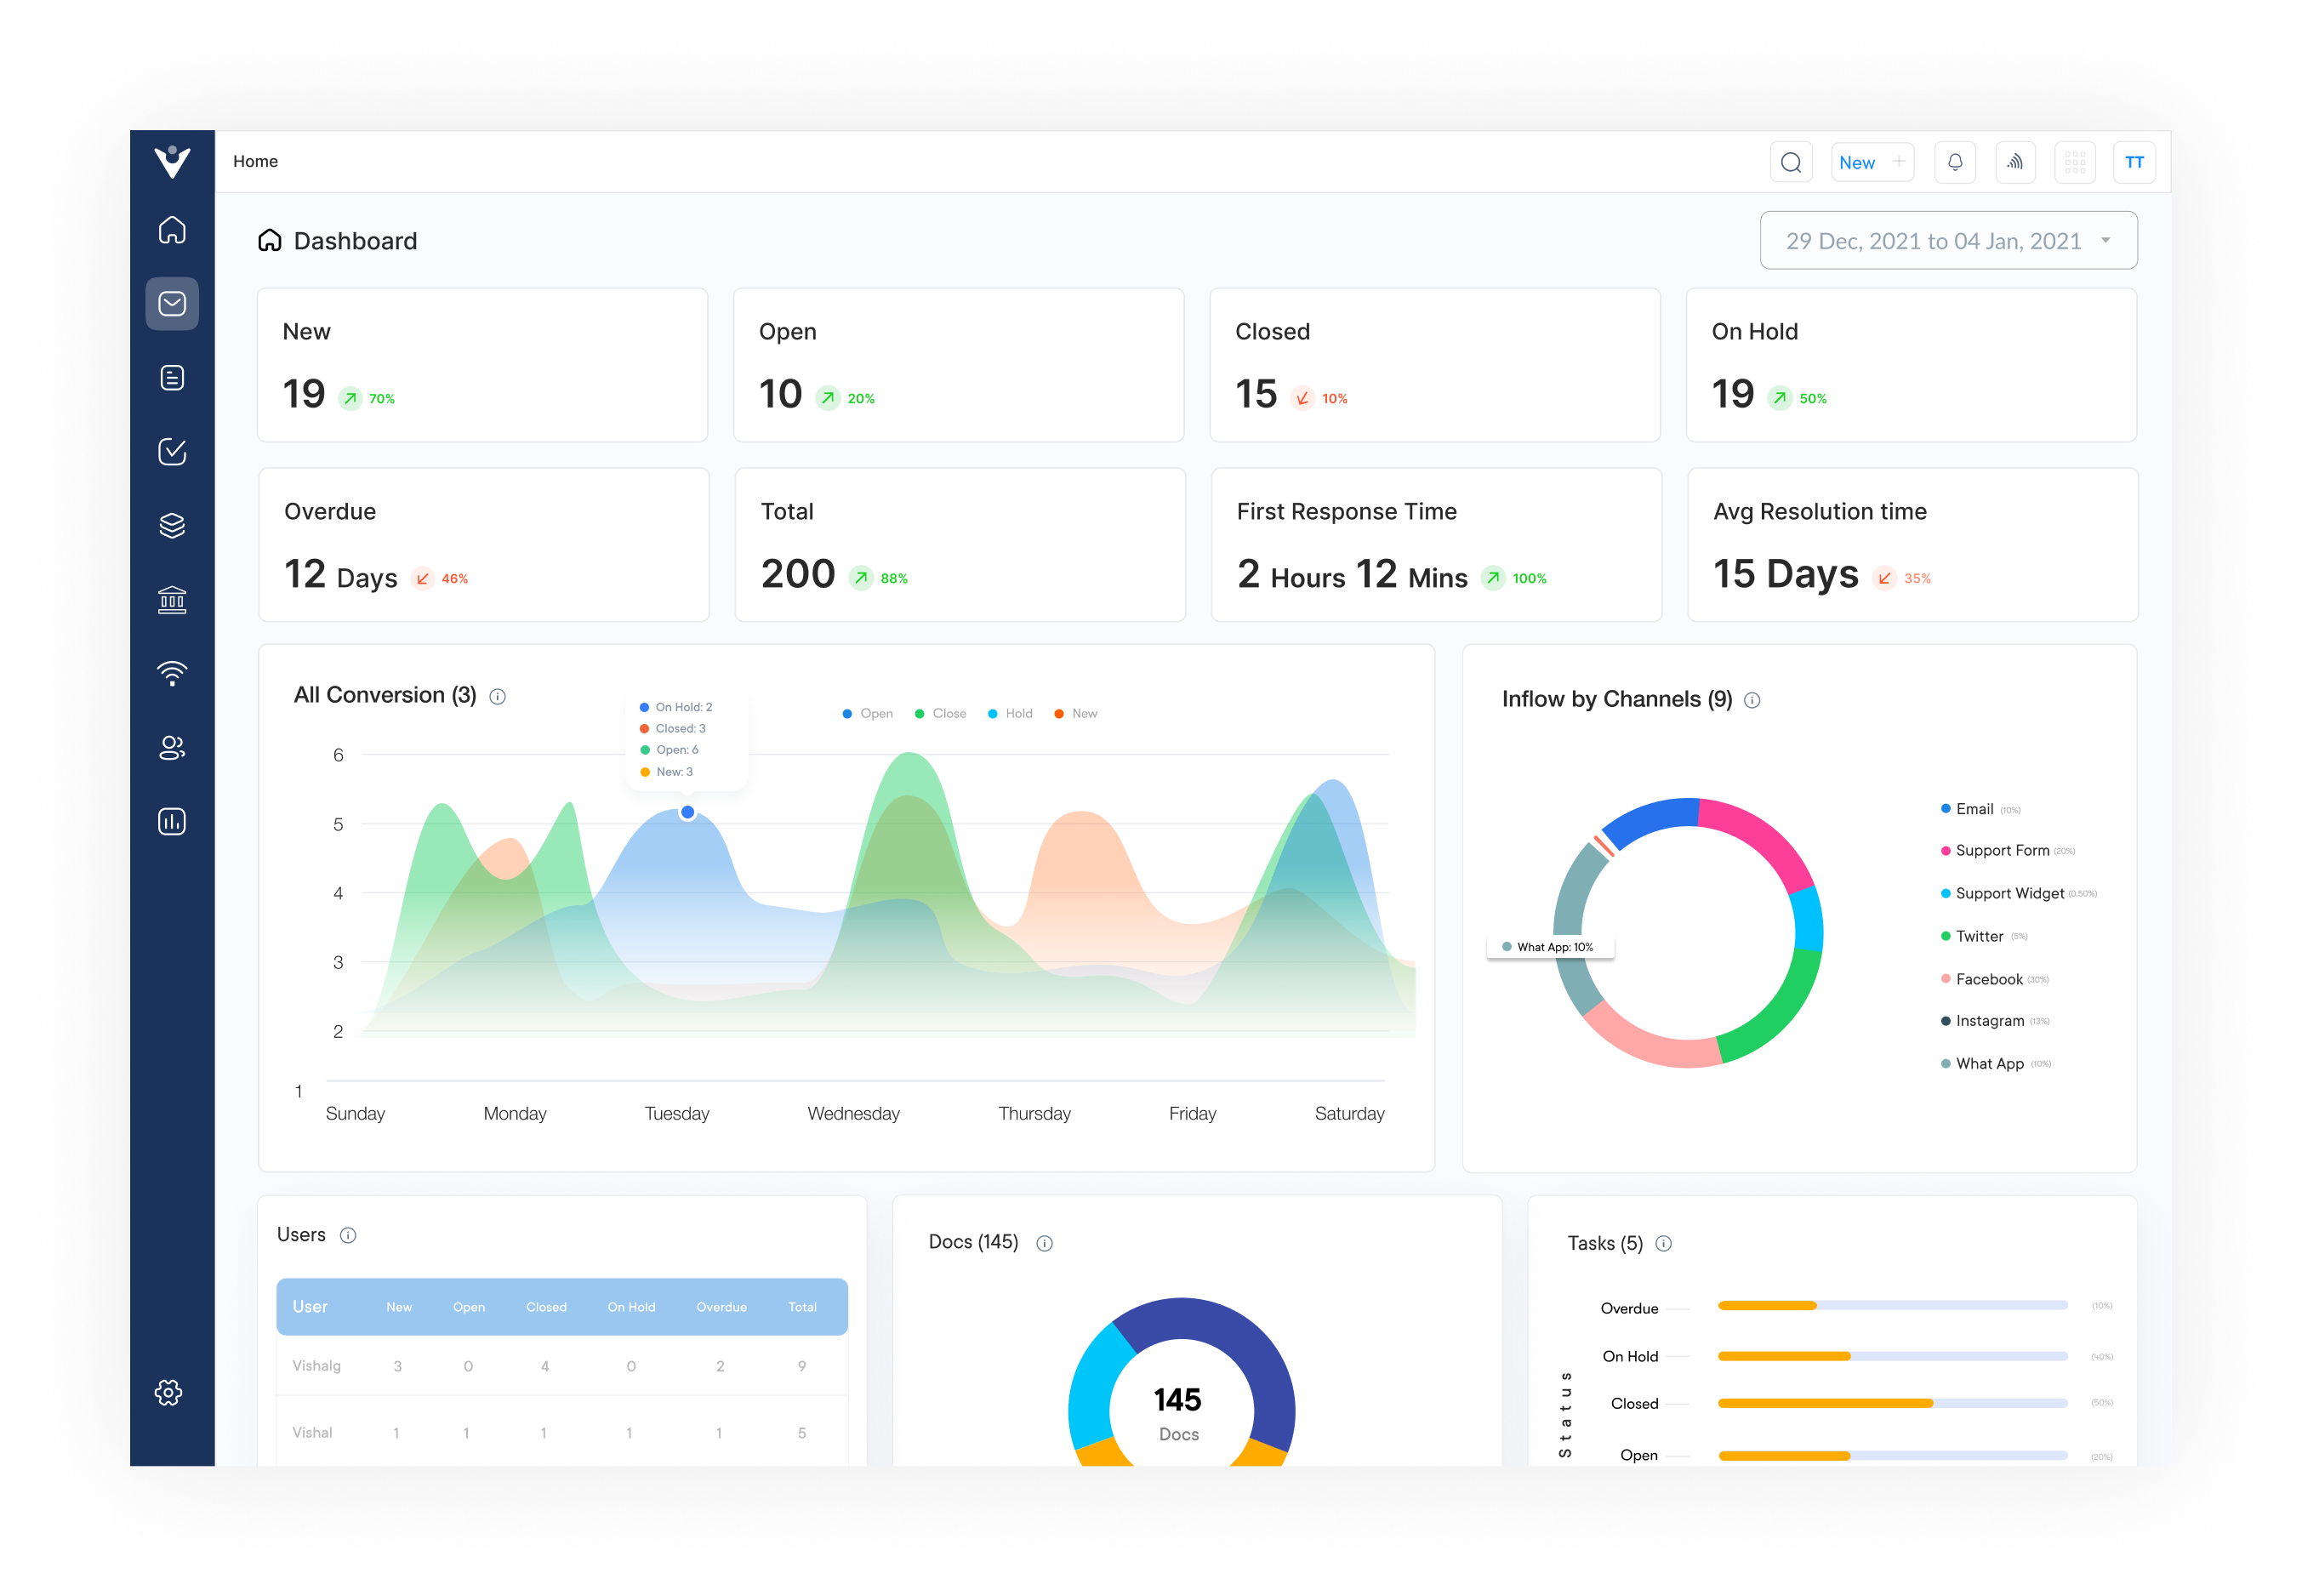
2. Veemo

veemo dashboard

Veemo is an omnichannel customer engagement suite of products to manage customer experience at scale across marketing, sales and support. The platform’s AI-powered tools help streamline customer service operations, boost efficiency and enhance overall customer experience.

Key features:

  • Omnichannel support: Veemo allows you to integrate all customer communication channels into one platform for seamless customer support.
  • Customer feedback collection: Veemo allows businesses to easily collect feedback from customers in real-time.
  • Centralized communication hub: Allows teams to collaborate on customer inquiries from a single, shared inbox.
  • Ticket management system: Organizes and tracks customer issues from creation to resolution. Includes features like status updates, assignment and SLA monitoring.
  • Client portal: Gives customers a secure, self-service platform to access information and support. This self-service option empowers customers and reduces the workload on support teams.
  • Self-service portal: Create a customizable help center with FAQs, articles and community forums for customer self-help.
  • Live chat and messaging: Engage customers in real-time across various messaging platforms and social media channels.

Pricing: Veemo offers various products There are three pricing plans – the Growth plan starts at $29/user/month. The Team plan is priced at $79/user/month. The Enterprise plan is priced at $149/user/month.

3. Qualtrics XM

Qualtrics XM (Experience Management) is a comprehensive platform designed to help businesses measure and improve customer, employee, product and brand experiences. It offers advanced survey and data analysis tools, enabling organizations to gather deep insights across various touchpoints in the customer journey.

Qualtrics XM provides great survey design tools with branching logic and customization options. Its predictive analytics as well as AI-driven insights help identify trends and areas for improvement. The platform offers real-time dashboards and alerts for immediate action on customer feedback.

CX Metrics: Transforming Data into Exceptional Customer Experiences

CX metrics serves as the compass guiding businesses towards excellence in the age of customer-centricity. By transforming raw data into actionable insights, these metrics empower organizations to craft experiences that truly resonate with their customers. From identifying pain points to celebrating successes, CX metrics provide a holistic view of the customer journey.

As we’ve explored, implementing a robust CX measurement strategy is not just about collecting numbers, it’s about listening to the voice of the customer and responding with meaningful improvements. By embracing CX metrics, companies can unlock the full potential of their customer relationships, driving loyalty, advocacy and sustainable growth. In the end, it’s not just about measuring experiences, it’s about creating exceptional ones.

FAQs on Customer Experience Metrics

Customer experience metrics provide crucial insights into customer satisfaction and loyalty, directly influencing retention. They help businesses identify at-risk customers, understand pain points, measure retention strategy effectiveness and personalize experiences. By tracking these metrics, companies can proactively address issues, enhance customer relationships and ultimately reduce churn rates.

Focusing on improving the customer experience through CX KPIs, helps businesses can drive business growth in several ways. A positive customer experience leads to increased customer loyalty, higher customer retention rates and positive word-of-mouth referrals. This, in turn, can lead to increased sales, revenue and overall business success. By using CX KPIs to continuously monitor and improve the customer experience, businesses can create a competitive advantage as well as drive sustainable growth in the long term.

Consumer experience metrics are vital for product development as they reveal customer needs, preferences and pain points. These insights guide innovation, help prioritize features and inform product roadmaps. By aligning product development with customer feedback, companies can create more user-centric products, increasing adoption rates and customer satisfaction.

Client experience metrics directly measure and influence customer satisfaction. They provide quantifiable data on customer sentiment, allowing businesses to track satisfaction trends, identify areas for improvement and set concrete goals. By monitoring these metrics, companies can quickly respond to satisfaction dips and continuously enhance the overall customer experience.

User experience metrics drive business strategy by providing data-driven insights into customer behavior and preferences. They help align organizational goals with customer needs, inform resource allocation, identify competitive advantages and demonstrate the ROI of customer-centric initiatives. These metrics enable companies to make strategic decisions that enhance customer satisfaction and drive growth.

CX KPIs and feedback are intrinsically linked. Many metrics are derived from direct customer feedback through surveys or reviews. While metrics provide quantitative data, feedback offers qualitative context. Together, they create a comprehensive view of the customer experience, helping businesses identify trends, prioritize improvements and develop more effective customer-centric strategies.

blog sidebar image

Quickstart Guides

Popular

Latest Blogs