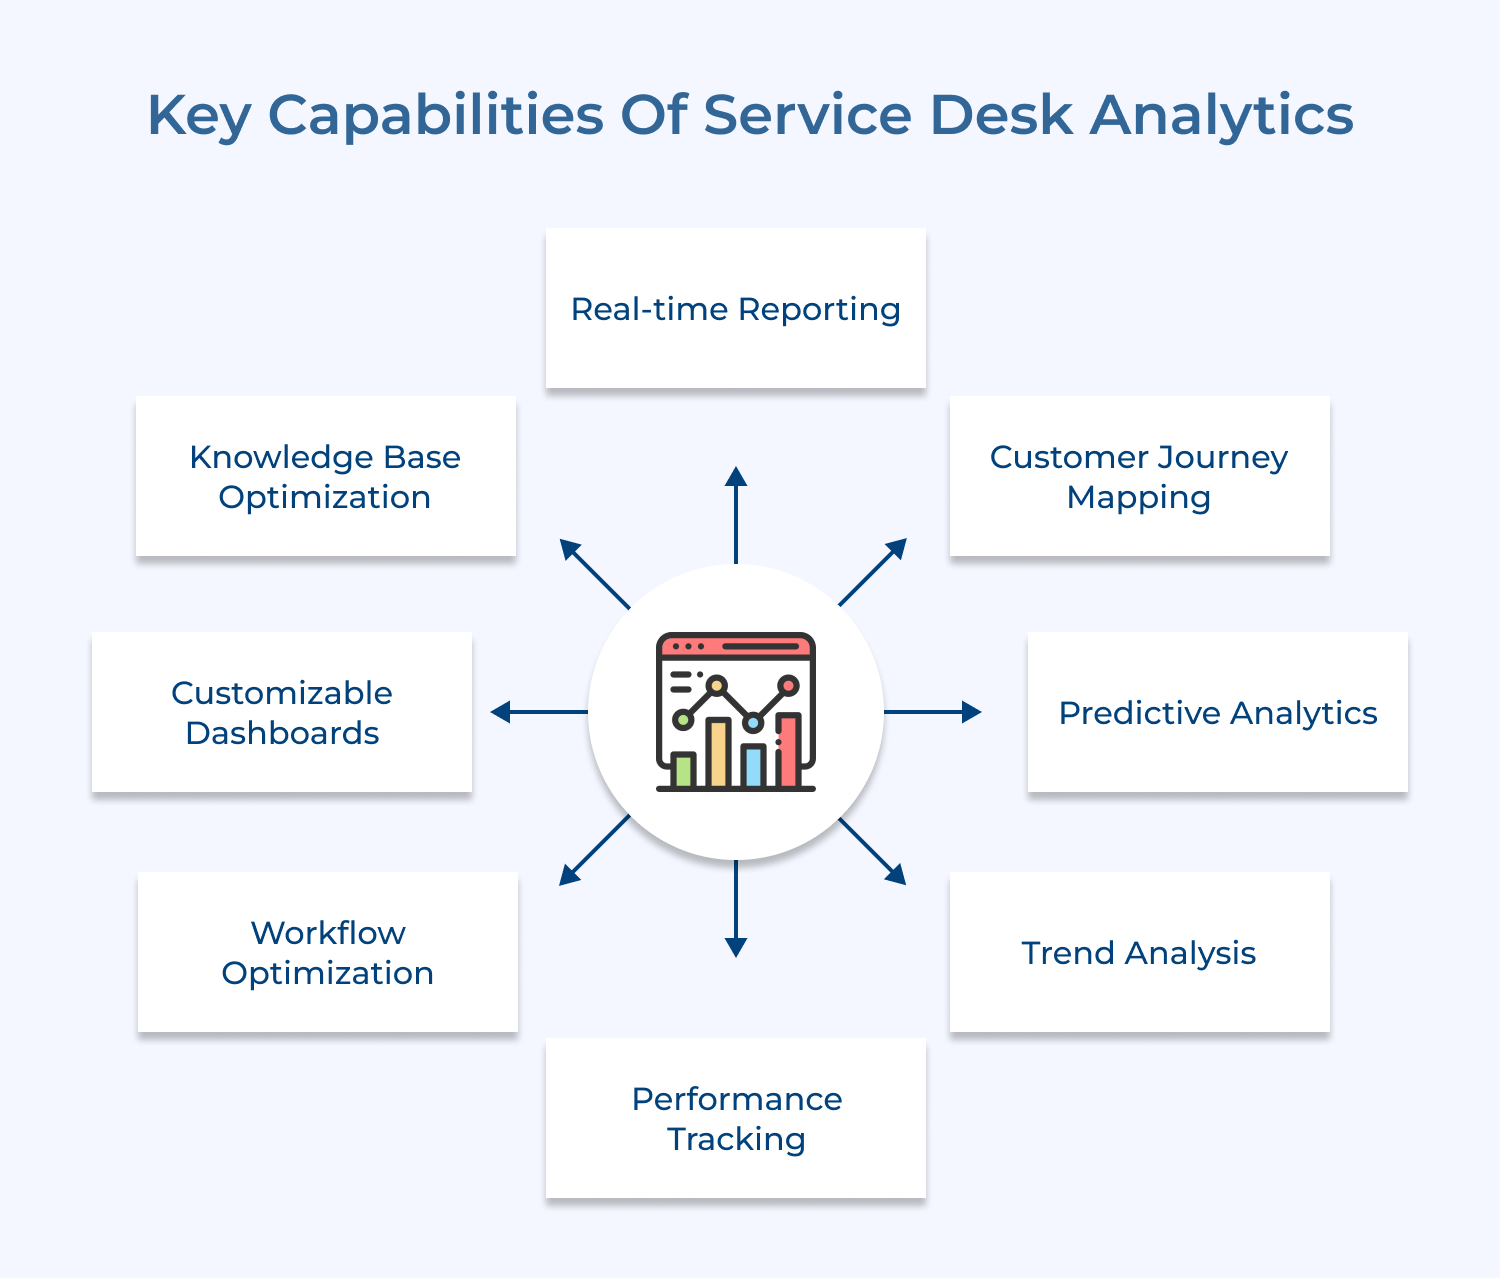
1. Real-time Reporting
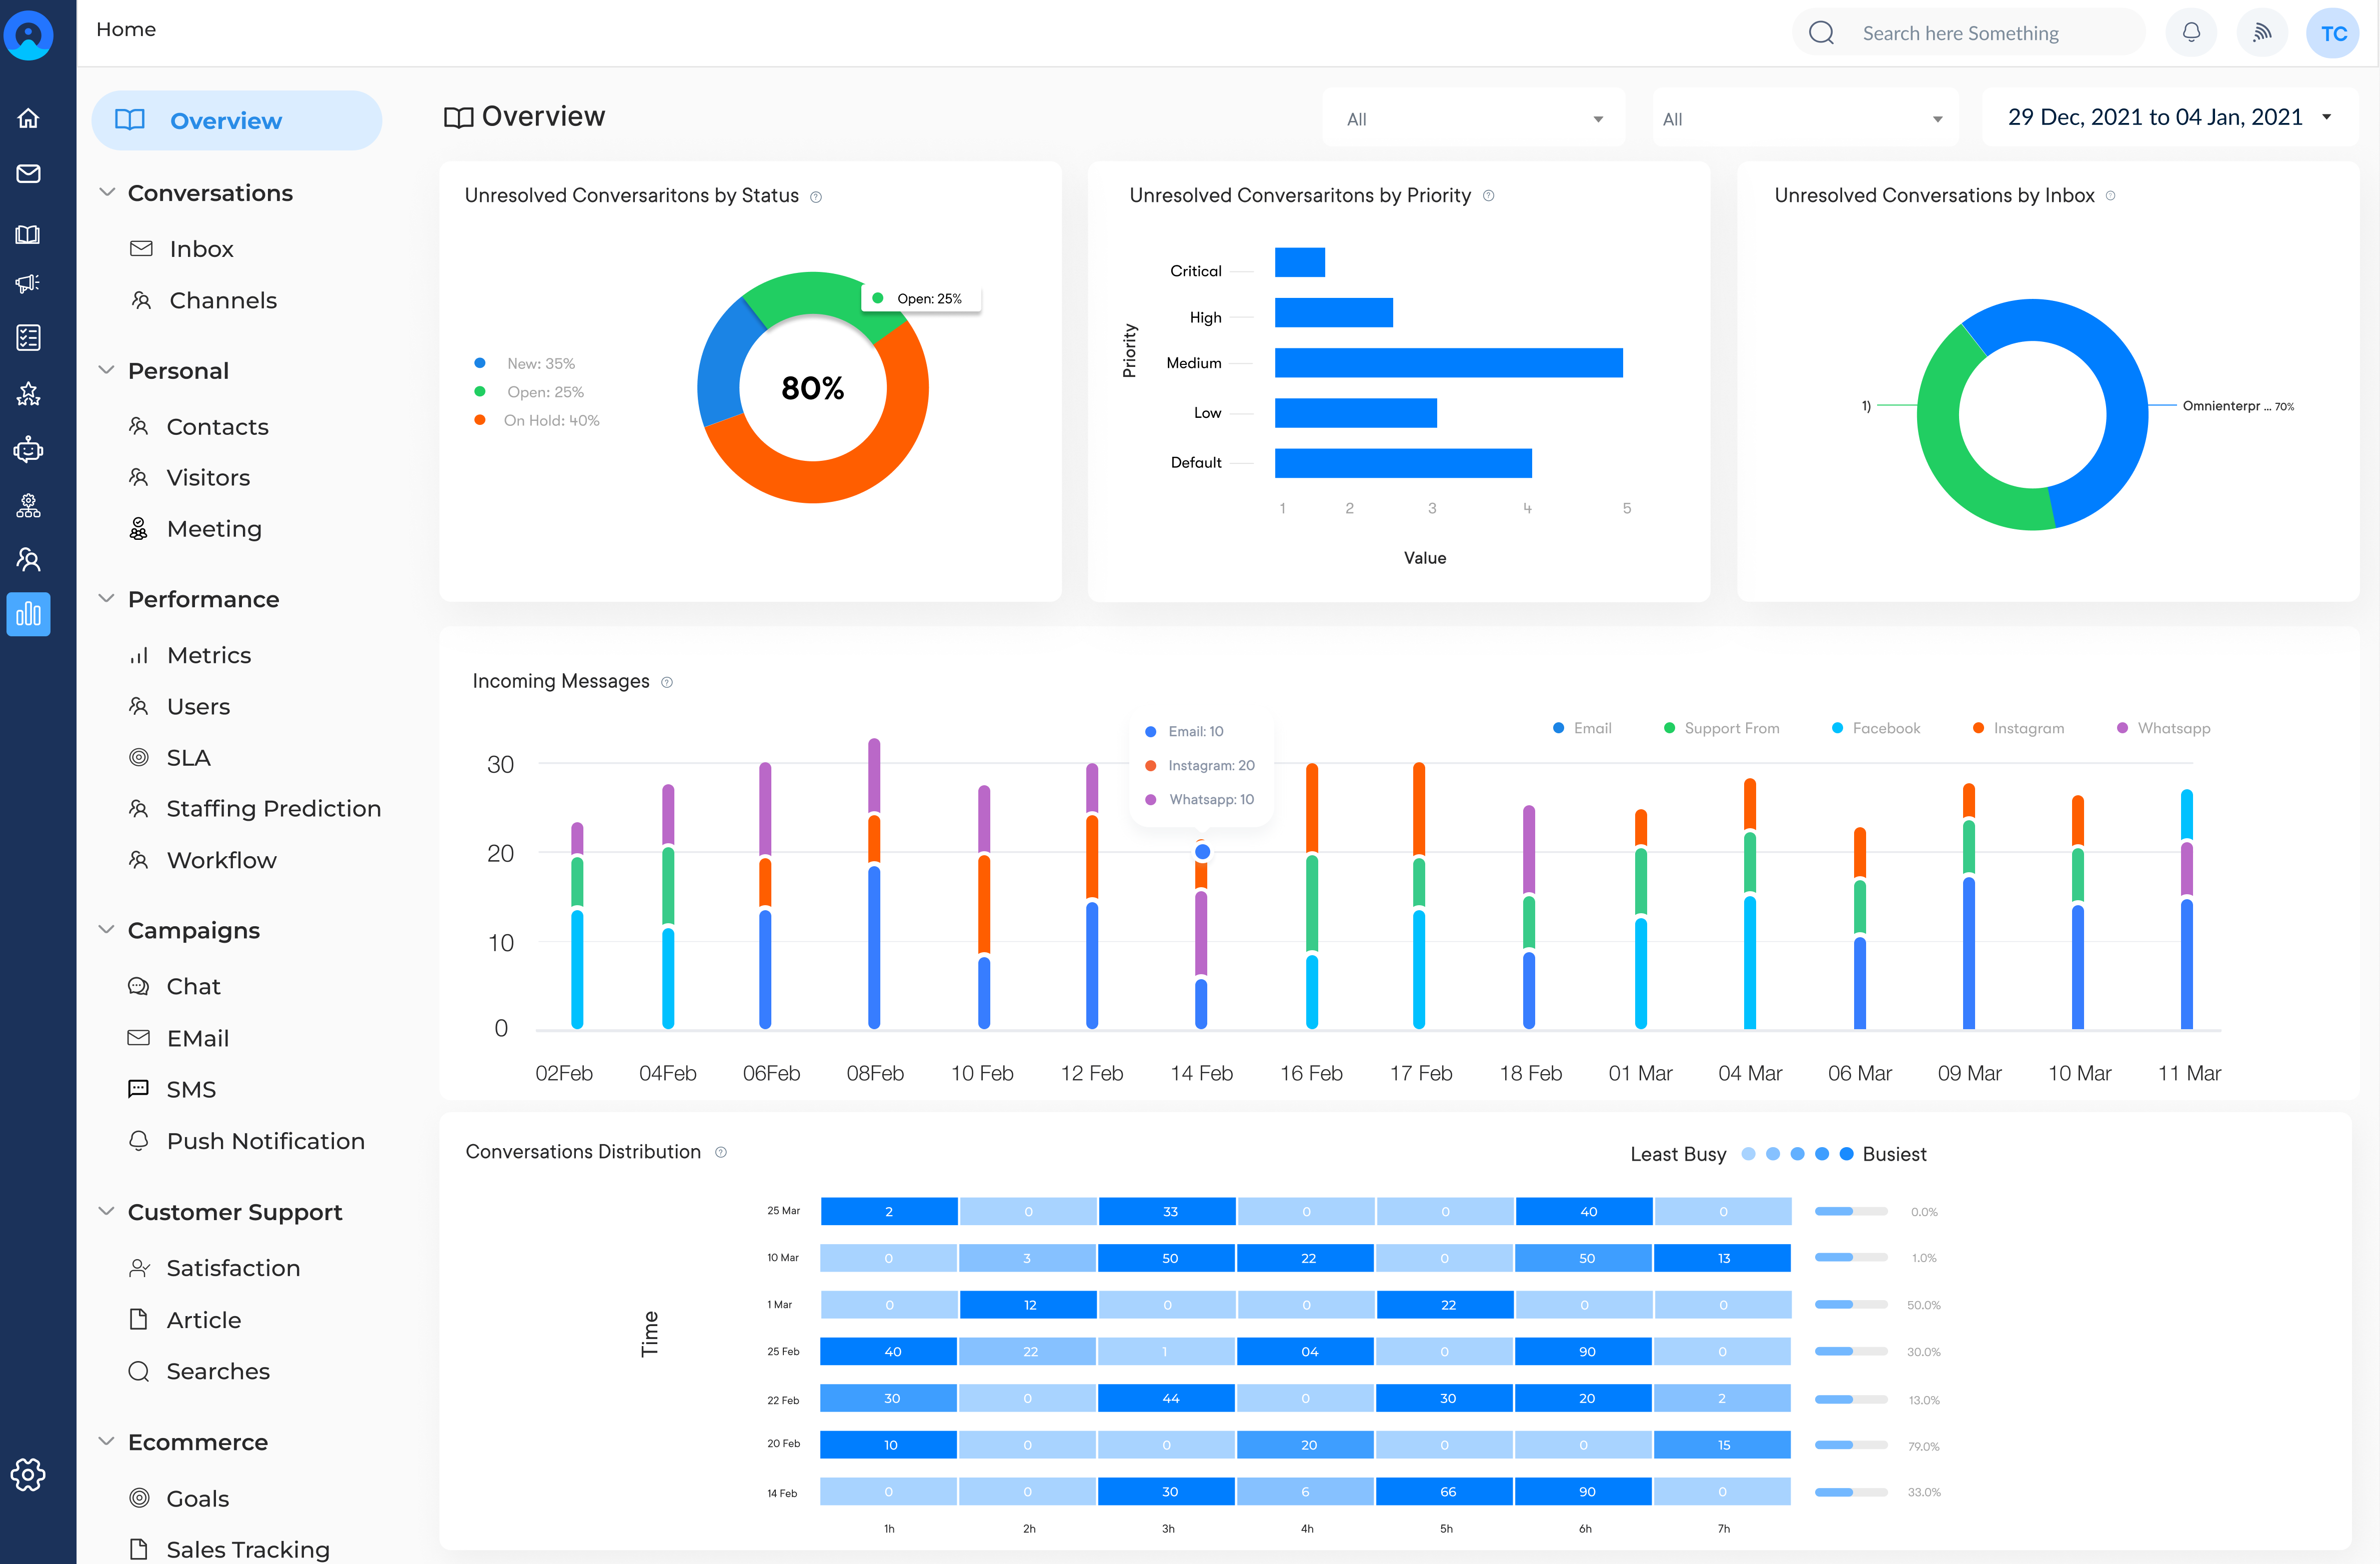
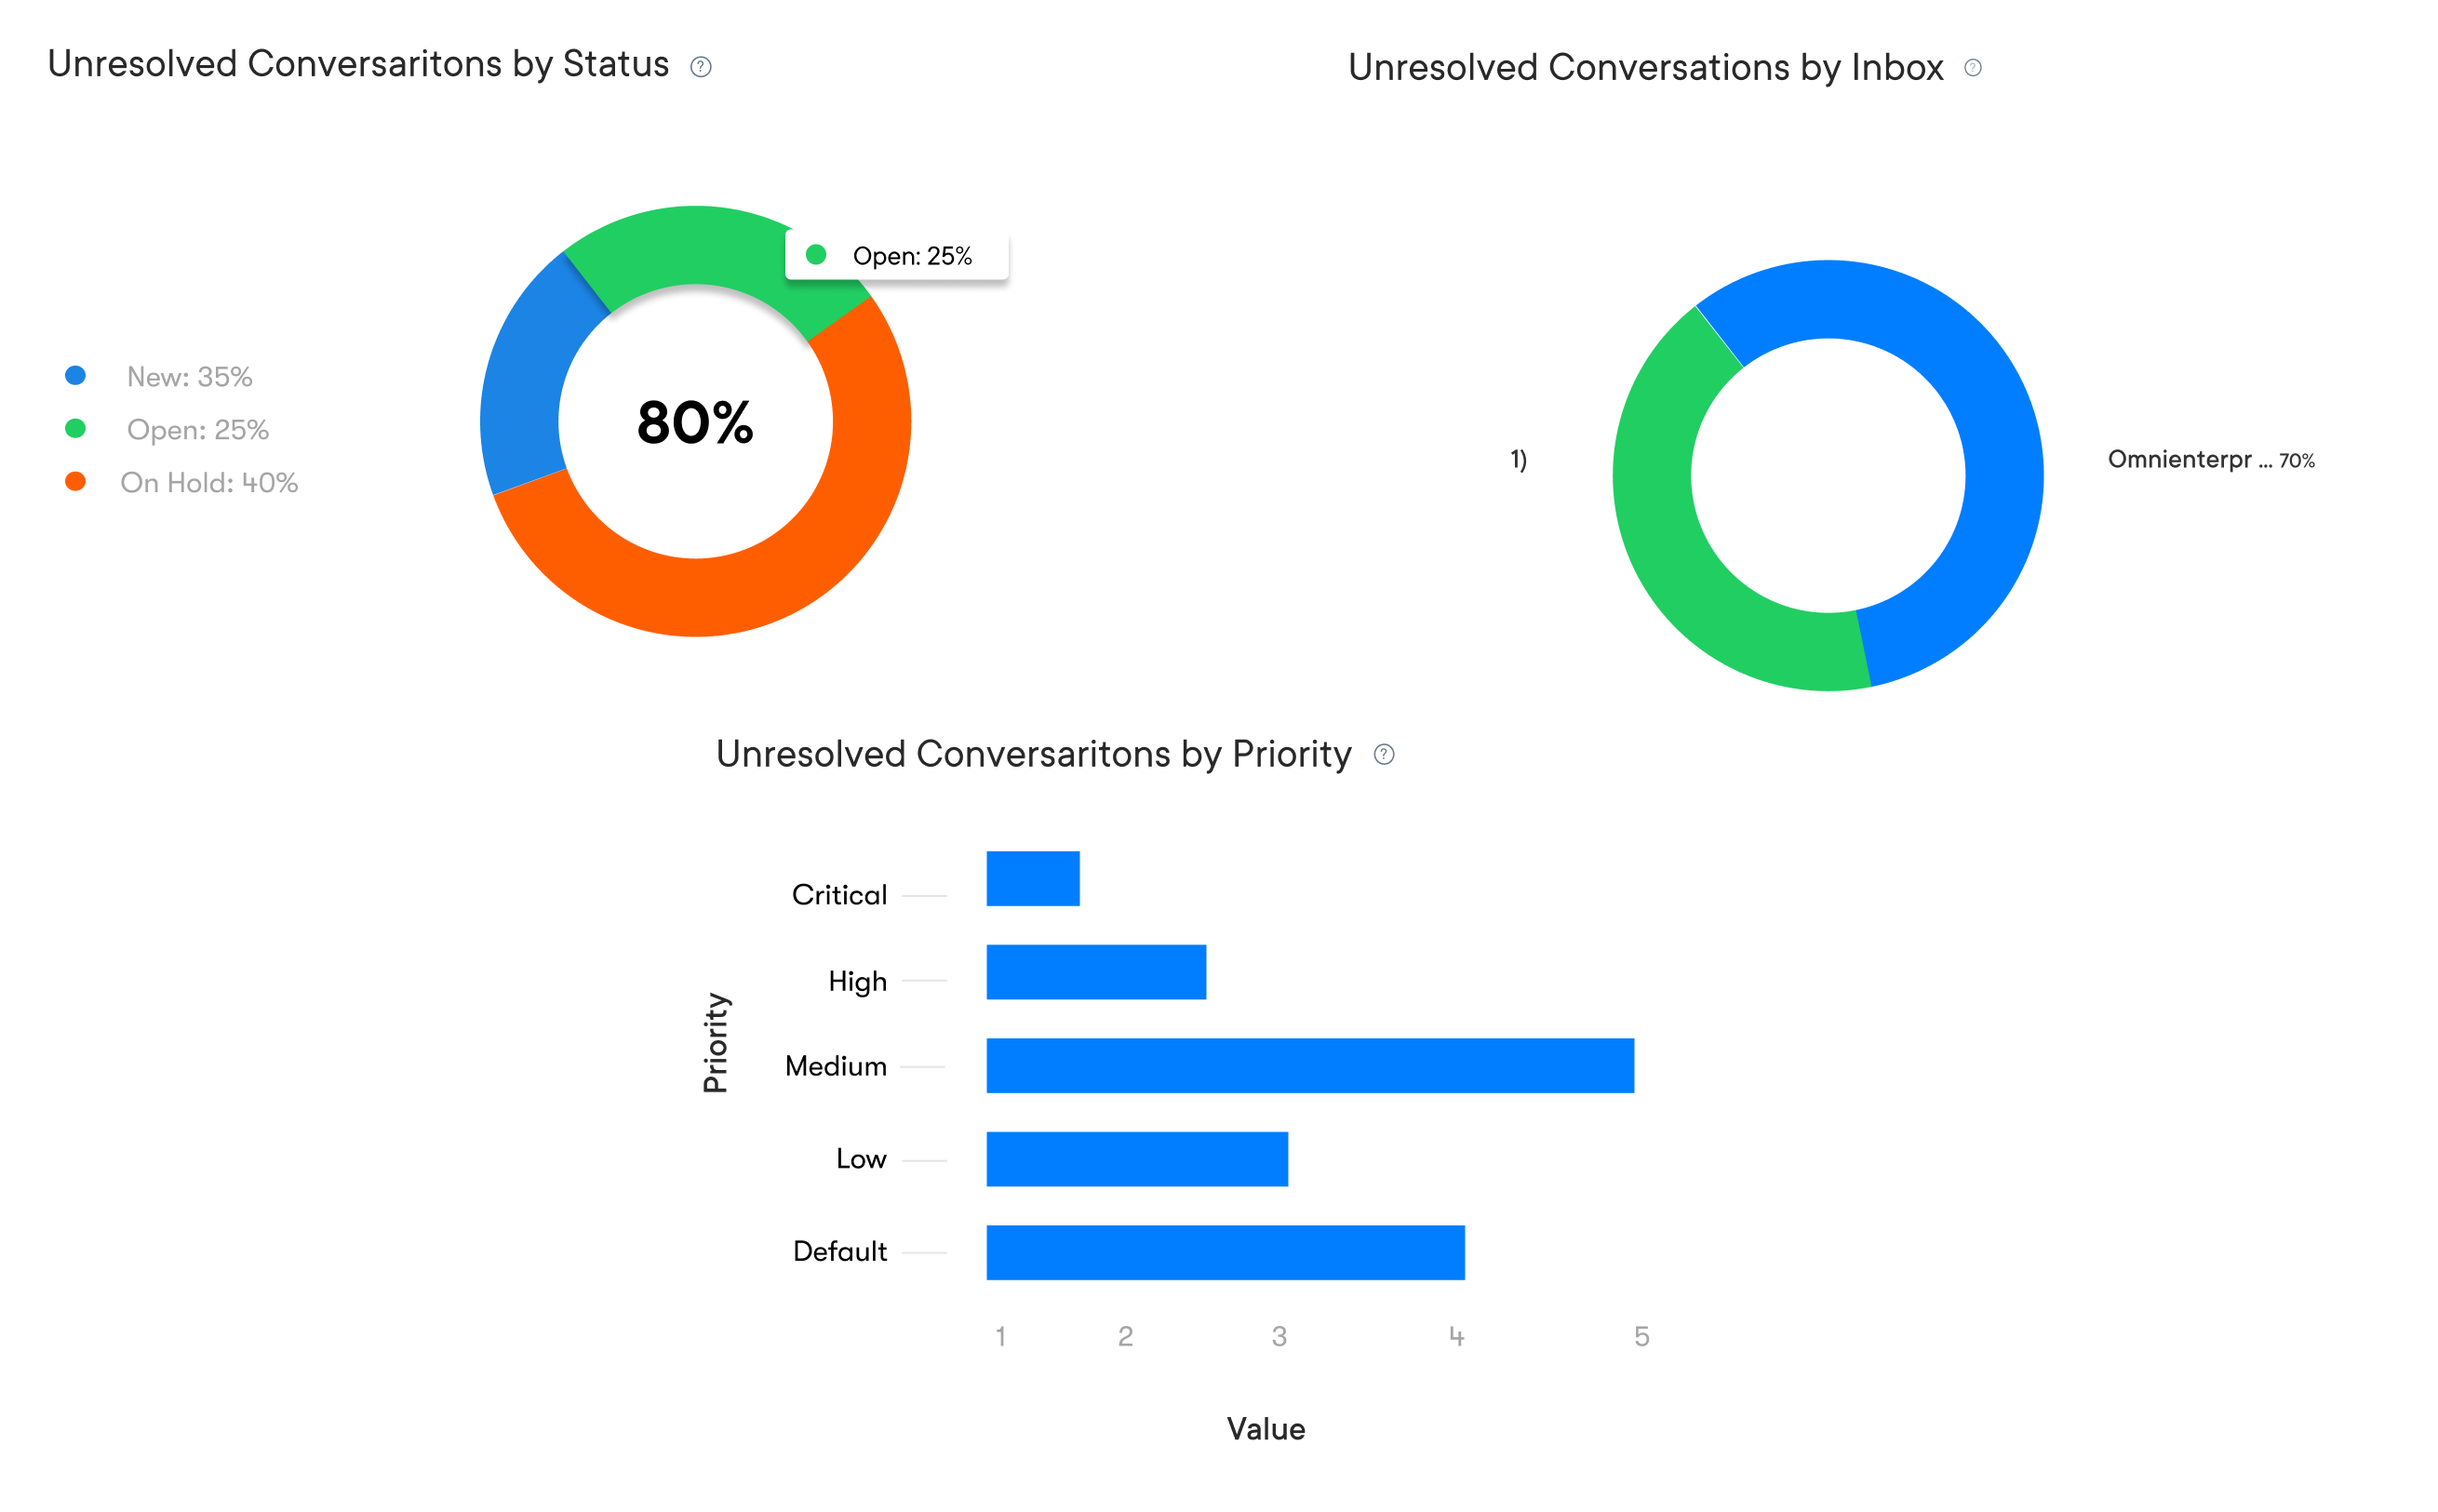
Real-time reporting provides up-to-the-minute information on various aspects of support operations. It allows managers and team leaders to monitor current performance, identify emerging issues as well as make quick decisions to address problems as they arise.
Real-time reports can include metrics such as active ticket count, average response time, and agent availability. By having access to this immediate data, support teams can proactively manage workloads, allocate resources effectively and ensure that service level agreements (SLAs) are met consistently.
2. Customer Journey Mapping
Mapping customer journey visualizes the entire customer experience from initial contact through to issue resolution. It allows support teams to understand the various touchpoints a customer encounters during their interaction with the helpdesk.
The insight enables teams to streamline processes, reduce friction in customer interactions and enhance overall satisfaction. It also reveals opportunities for proactive support interventions and personalized service delivery.
3. Predictive Analytics
Predictive Analytics uses historical data and machine learning algorithms to forecast future trends. It enables support teams to anticipate problems before they occur, allowing for proactive measures to be implemented.
For example, predictive analytics can forecast peak periods of ticket volume, enabling managers to adjust staffing levels accordingly. It can also identify patterns that may lead to customer churn, allowing for targeted retention efforts.
4. Trend Analysis
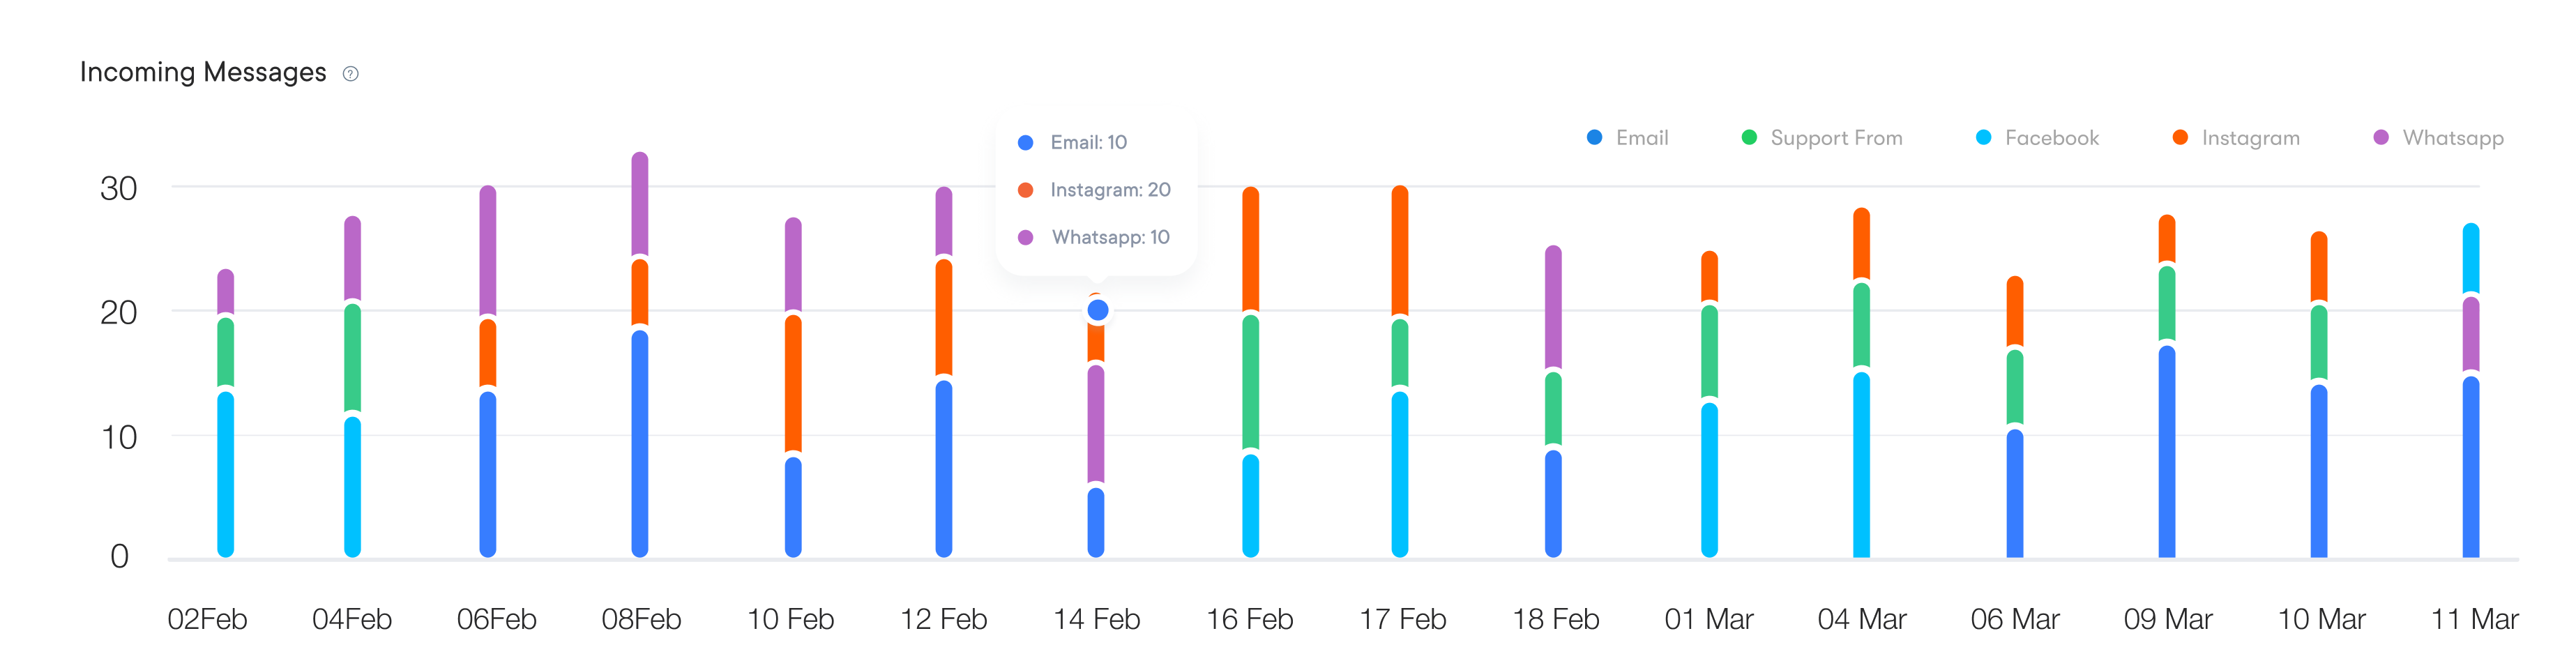
Trend analysis involves examining historical data to identify patterns and trends over time. It helps support teams understand long-term changes in ticket volumes, types of issues, customer behavior and support performance. Businesses use this trend to make informed decisions about training needs and process improvements.
Trend analysis also highlights seasonal variations in support demands, recurring issues that may require systemic solutions and shifts in customer preferences for support channels.
5. Performance Tracking
Performance tracking allows businesses to monitor and measure the effectiveness of their support operations. It includes tracking individual agent performance, team productivity and overall helpdesk efficiency.
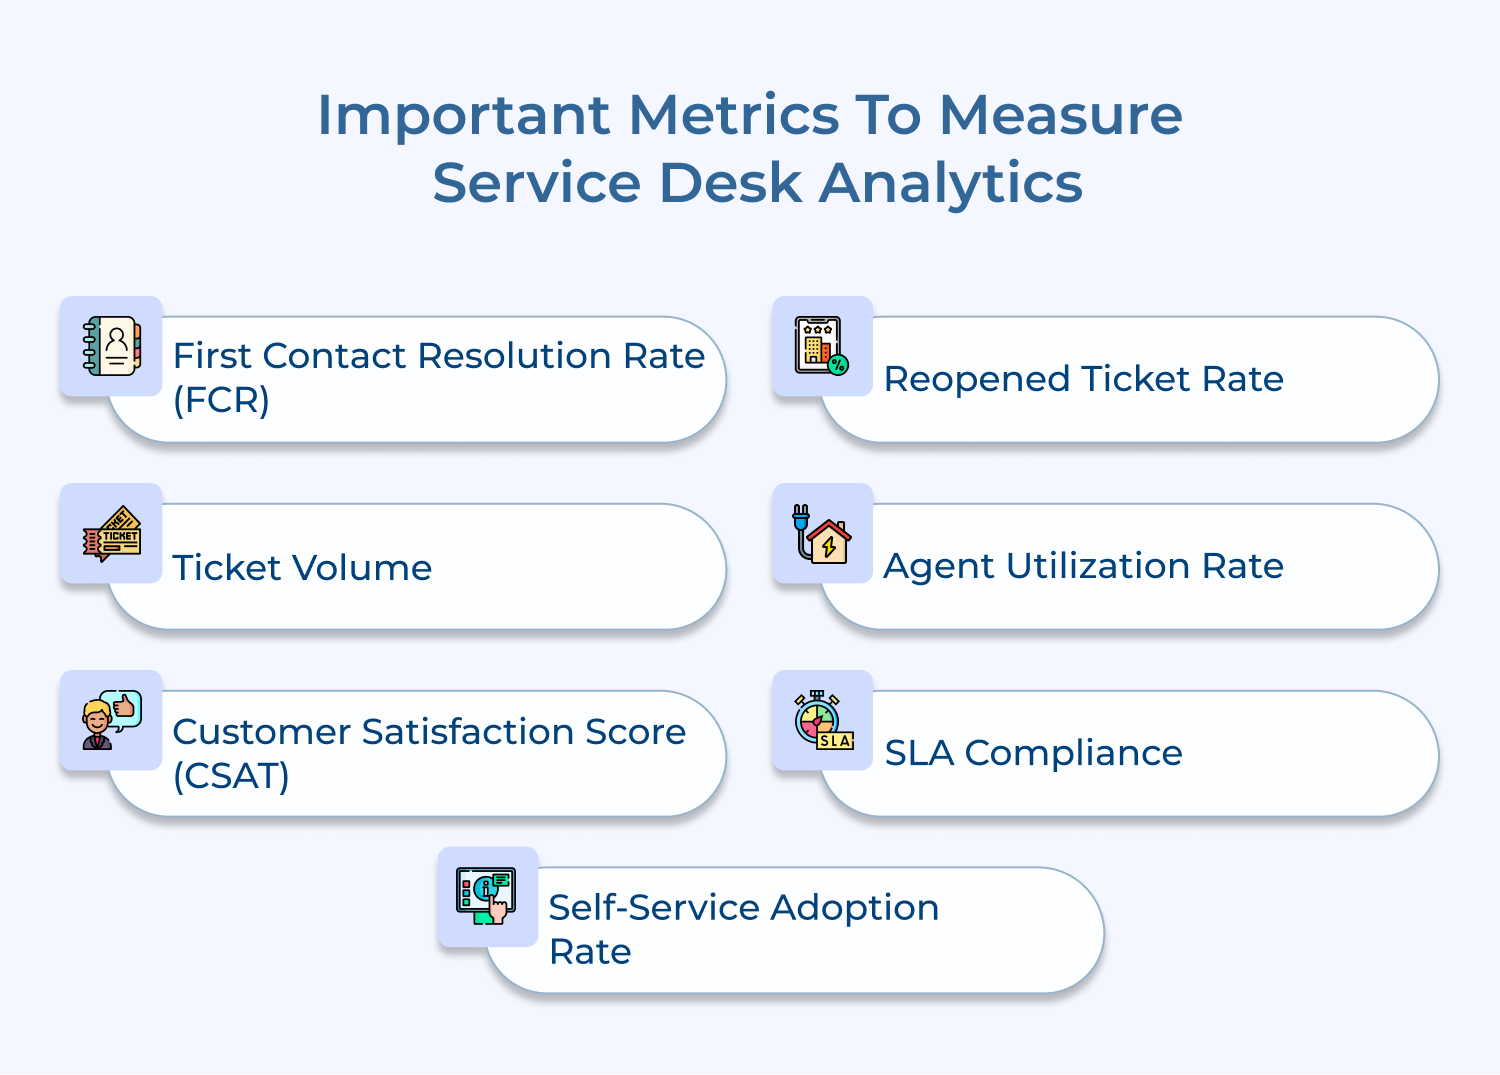
Key performance indicators (KPIs) for tracking are:
- Average handling time
- First contact resolution rate
- Customer satisfaction scores
Managers can identify top performers, recognize areas for improvement and implement targeted training programs. Performance tracking also facilitates data-driven performance evaluations and helps in setting realistic goals for the support team.
6. Workflow Optimization
Workflow Optimization leverages analytics to identify inefficiencies in support processes and suggest improvements. It analyzes the flow of tickets through the support system, identifying steps or areas where automation could be beneficial.
Optimizing workflows helps helpdesks reduce resolution times, minimize errors and improve overall efficiency. It involves automating ticket routing, streamlining escalation processes, or implementing AI-powered chatbots. Workflow optimization ensures that support resources are used effectively and that customers receive faster, more efficient service.
- Automating ticket routing
- Streamlining escalation processes
- Implementing AI-powered chatbots
7. Customizable Dashboards
Customizable Dashboards provide a visual representation of key metrics and performance indicators tailored to the specific needs of different users. It allows managers, agents and executives to create personalized views of the data most relevant to their roles.
For example, a support agent might have a dashboard focused on their individual performance and current ticket queue, while a manager’s dashboard might display team-wide metrics as well as SLA compliance rates.
Genuine value from customizable dashboards depends on a few considerations:
- Role-Based Widgets: Configure relevant metrics based on each user’s team or responsibility level.
- Real-Time Data Refresh: Make sure dashboards update instantly, which reflects live performance rather than outdated snapshots.
- Drill-Down Capability: Allow users to click into summary metrics for ticket-level context and analysis.
Customizable dashboards enable quick access to critical information, facilitate data-driven decision-making at all levels and promote transparency across the organization.
8. Knowledge Base Optimization
Knowledge Base optimization uses analytics to improve the effectiveness of self-service support resources. It analyzes user interactions, identifying frequently accessed articles, search patterns and gaps in available information.
Sustaining an optimized knowledge base depends on a few ongoing practices:
- Search Query Analysis: Review failed searches to reveal missing content customers actively.
- Article Performance Tracking: Identify low-rated or rarely used articles that highlight candidates for revision.
- Regular Content Refresh: Update outdated articles to ensure accuracy as products and policies continue evolving.
Businesses can continually refine and expand their self-service content by understanding how customers use the knowledge base. An optimized knowledge base significantly reduces ticket volumes by enabling customers to find solutions, while also empowering support agents with accessible information.