CSAT vs NPS: Which Customer Satisfaction Metric Should You Choose?
CSAT vs NPS are essential metrics that reveal customer satisfaction and loyalty, guiding service improvements and long-term growth.

CSAT vs NPS are essential metrics that reveal customer satisfaction and loyalty, guiding service improvements and long-term growth.
Most businesses collect customer feedback but still can’t predict churn reliably. Improving customer retention by just 5% can boost profits by up to 95%. This guide shows you exactly which metric fits your CX goal and when to use it.
This page covers use cases, score calculation, and full CX stack integration not survey design or tool selection. CSAT vs NPS defined: CSAT measures transactional satisfaction; NPS captures long-term customer loyalty and brand advocacy.
Customer Satisfaction Score (CSAT) is a metric that measures how satisfied a customer feels after a specific interaction or experience with your business. It captures real-time sentiment at key touchpoints, giving you a direct window into what your customers actually feel.
Knowing your CSAT score helps you spot service gaps before they snowball into bigger problems. It pinpoints exactly where your team is delivering and where the experience is quietly frustrating your customers. When you act on CSAT data consistently, you stop making decisions based on assumptions. Your team gains a clear direction, fixing what is broken and doubling down on what is already working well.
The CSAT Scale of Measurement:
Calculating CSAT is straightforward, but knowing how to read the number is where the real value lies. It gives you a clear percentage that reflects exactly how your customers feel after every interaction.
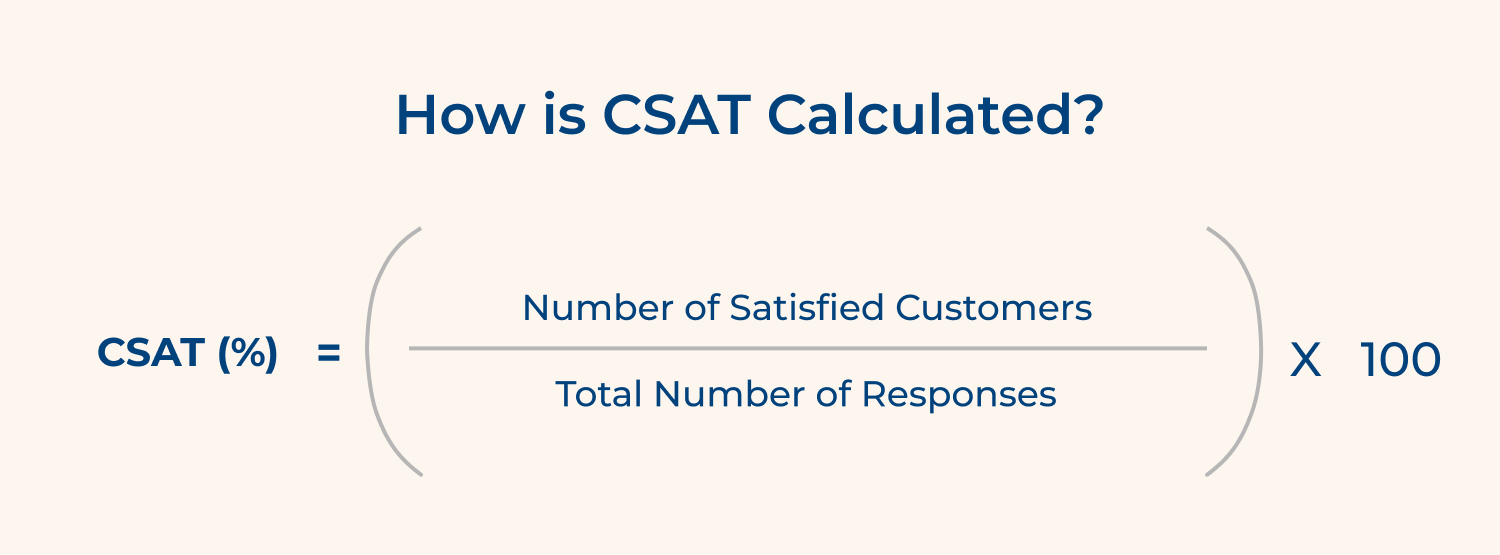
CSAT (%) = (Number of Satisfied Customers / Total Number of Responses) × 100
Breaking Down the Formula Components:
A CSAT score above 75% is generally considered healthy across most industries. Scores between 75% and 85% signal that your team is delivering consistently — but there is still room to improve. Anything above 85% means your customers are leaving interactions feeling genuinely valued.
Here is how you calculate your CSAT score in four simple steps:
Your support team handled 200 customer interactions in a month. Out of 200 respondents, 160 customers rated their experience a 4 or 5.
|
Metric |
Value |
| Satisfied Customers | 160 |
| Total Responses | 200 |
CSAT (%) = (160 / 200) × 100 = 80%
What this tells you: An 80% CSAT score means 8 out of every 10 customers left the interaction feeling satisfied — a solid benchmark to build on.
Net Promoter Score (NPS) is a metric that measures how likely your customers are to recommend your business to someone they know. It goes beyond a single interaction giving you a pulse on the overall relationship your customers have with your brand.
Tracking NPS regularly helps you understand whether your customers are truly loyal or just staying until a better option comes along. It separates the customers who actively champion your brand from the ones who are silently drifting away.
When you dig into your NPS trends over time, you get an honest picture of your brand’s long-term health. It tells you whether the experience you are delivering is strong enough to turn customers into your biggest growth drivers.
The NPS Scale of Measurement:
NPS calculation is simple on the surface, but the real insight comes from understanding what sits behind the number. It is not just a score; it is a signal that tells you where your customer relationships actually stand and what needs your attention next.

Formula
NPS = % Promoters − % Detractors
Breaking Down the Formula Components:
Once your survey responses are in, group your customers into Promoters, Passives and Detractors based on their scores. Calculate the percentage of each group against total responses. Then subtract your Detractor percentage from your Promoter percentage and that final number is your NPS. It can range anywhere from -100 to +100.
Here is what a good NPS score looks like across four key industries:
You surveyed 300 customers after their quarterly experience with your product. Here is how their responses broke down:
|
Category |
Number of Respondents |
Percentage |
| Promoters (9-10) | 150 | 50% |
| Passives (7-8) | 90 | 30% |
| Detractors (0-6) | 60 | 20% |
| Total | 300 | 100% |
NPS = 50% − 20% = +30
What this tells you: An NPS of +30 means your Promoters comfortably outnumber your Detractors — a positive sign. But with 30% of customers sitting in the Passive zone, there is a clear opportunity to push that score higher by converting fence-sitters into loyal advocates.
Here is how the two metrics truly differ and what that means for your CX strategy.
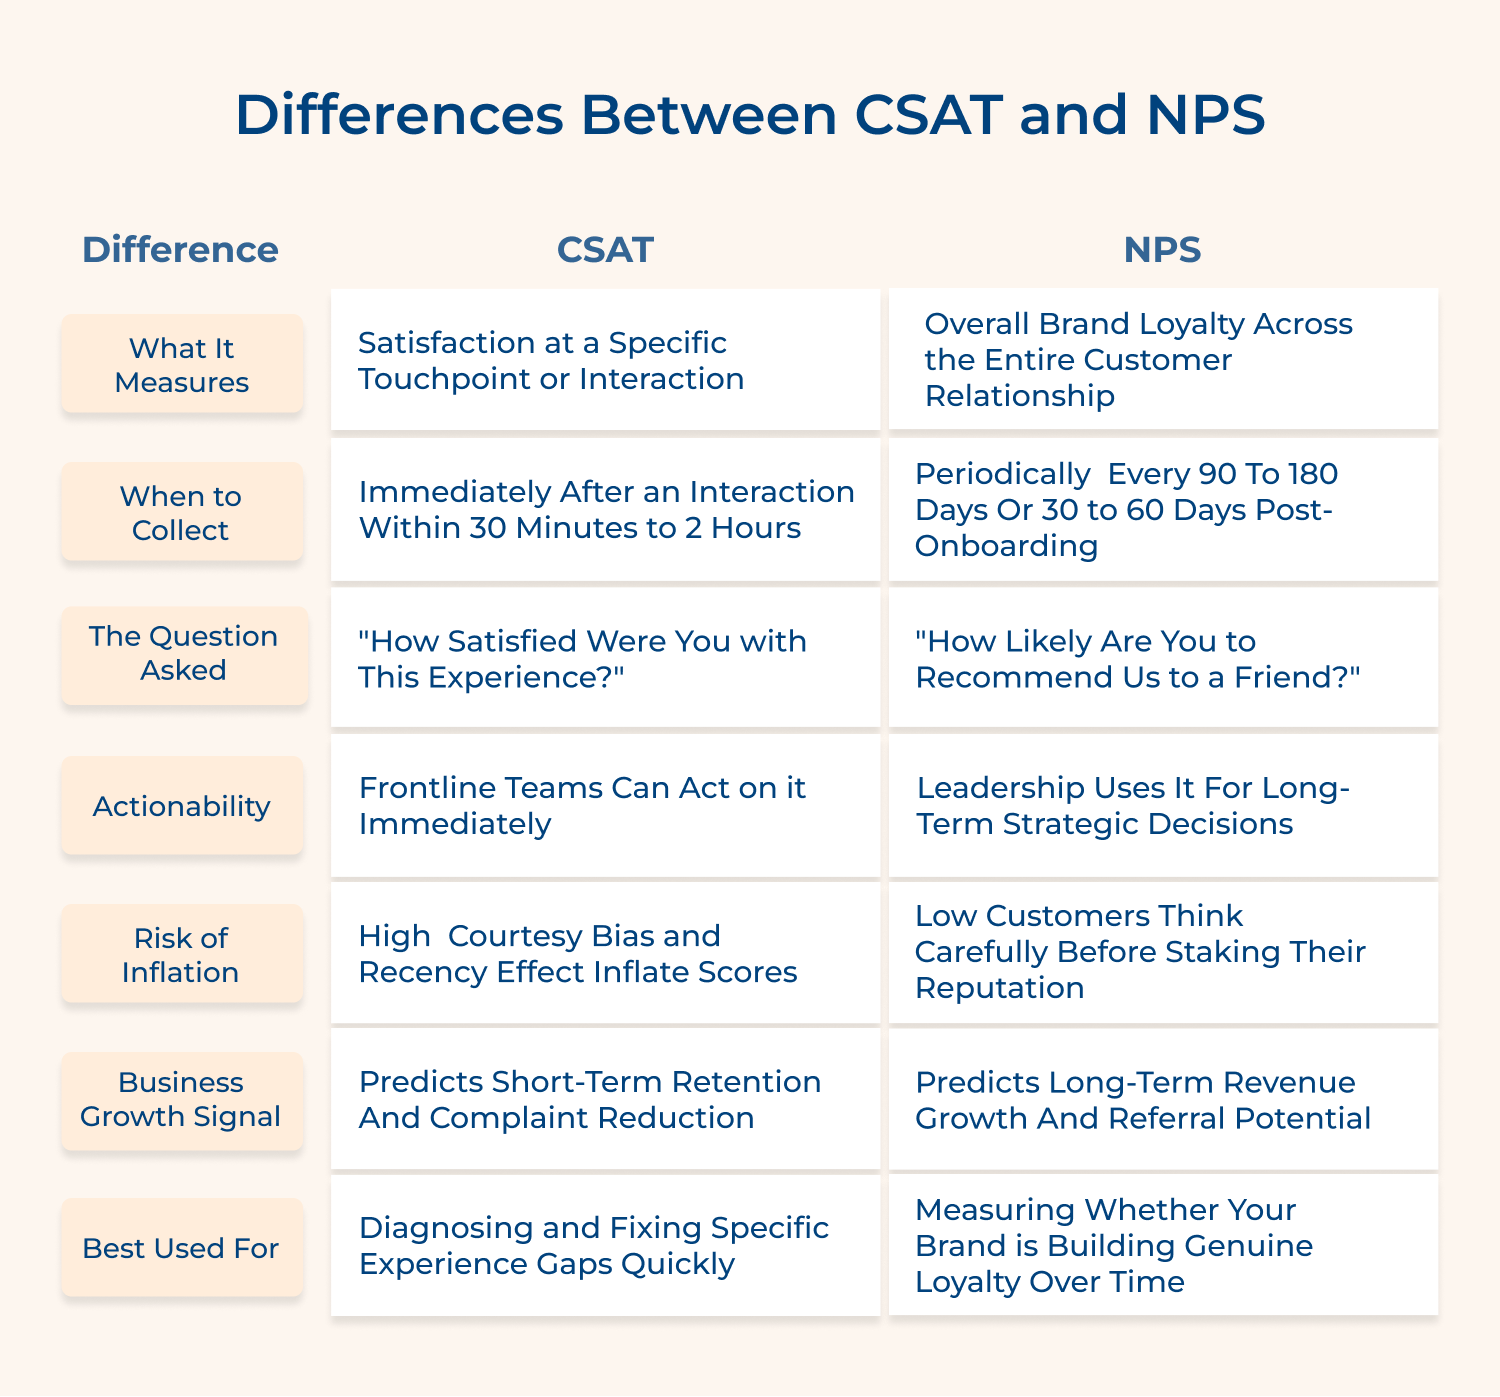
CSAT measures satisfaction at a specific touchpoint: a support call, a delivery, an onboarding session. It captures the emotional response to a single experience telling you whether that particular moment landed well or fell short. Think of it as a real-time temperature check on your day-to-day operations.
NPS measures the overall loyalty a customer feels toward your brand. It captures the cumulative weight of every experience a customer has had asking whether they trust your brand enough to put their name behind it. It is not about one moment, it is about the entire relationship.
A customer can walk away happy after a support call and still not recommend your brand to a friend. That gap between satisfaction and loyalty is exactly where most businesses lose ground without realizing it.
Example: A customer rates their delivery experience 5/5 on CSAT but gives your brand an NPS of 6 — satisfied with the moment but not loyal to the brand.
Key Takeaways:
CSAT is collected immediately after an interaction, giving you real-time feedback while the experience is still fresh. Send it two days later, customers have already moved on, the emotional accuracy drops significantly and the data loses its value.
NPS is sent periodically quarterly or bi-annually to capture how sentiment has shifted over time. Send it too frequently, survey fatigue quietly kills your response rates and the quality of feedback you receive.
Here is a practical timing framework every CX team should follow:
CSAT asks: “How satisfied were you with this experience?” is direct and interaction-specific. It puts customers in evaluation mode for a specific moment designed to surface an immediate emotional reaction and diagnose specific touchpoints quickly.
NPS asks: “How likely are you to recommend us?” broader and relationship-focused. It asks customers to consider the full weight of their experience before answering, which is why the score carries far more strategic significance than a single interaction rating.
The question itself is only half the job. What comes after it determines how useful the data actually is:
CSAT gives you granular, moment-level data that frontline teams can act on immediately. A support manager can look at a low CSAT score from yesterday and brief the team that same morning fixing a broken process or coaching an agent before the same issue repeats.
NPS gives you a directional signal built for leadership and long-term strategy. A 10-point NPS drop over a quarter requires cross-functional analysis of product, marketing, customer success and leadership all need to be in the room to understand what shifted, how to reverse it.
Here is how each metric maps to the right team inside your organization:
For example a 20% drop in post-call CSAT on Mondays reveals an understaffing problem, a fix that operations can identify and implement within the same week.
CSAT scores tend to run high because customers rate individual interactions generously even when their overall experience is poor. Courtesy bias plays a big role customers default to a 4 when they genuinely mean a 3. The recency effect compounds this pleasant ending to an interaction colors the entire rating regardless of what happened before.
NPS is significantly harder to inflate because it asks customers to stake their own reputation on a recommendation. When someone considers recommending a brand to a friend, they think carefully — because a bad recommendation reflects on them personally. That accountability raises the bar for what a genuinely positive score represents.
Key Takeaways:
Example: A telecom company holds an 82% CSAT score but an NPS of 12 customers tolerate individual interactions but would never recommend the brand to someone they know.
CSAT is a strong indicator of short-term retention. Satisfied customers are less likely to complain or churn immediately after key interactions. A 5% increase in retention can increase profits by 25% to 95% and high CSAT scores directly correlate with lower complaint volumes, freeing up support capacity and reducing operational costs.
Key Takeaways:
NPS is a stronger predictor of long-term revenue growth. Promoters are 4x more likely to refer new customers, and that referral revenue carries zero acquisition cost with higher lifetime value. A consistently rising NPS also signals that your brand experience is outpacing competitors, often before your market share data confirms it.
CSAT is the right starting point when you need rapid feedback on a specific experience. If your team is small, your product is new, or you are fixing a specific part of your journey, CSAT gives you the focused signal you need to make quick improvements and keep your frontline teams accountable.
NPS becomes essential once your core interactions are consistently performing and you are ready to think at a brand level. It tells you whether customers are staying out of habit or out of genuine loyalty and that distinction separates a business that survives from one that grows sustainably over time.
Key consideration:
Collecting scores is the easy part knowing what to do with them is where most CX programs either grow or stall.
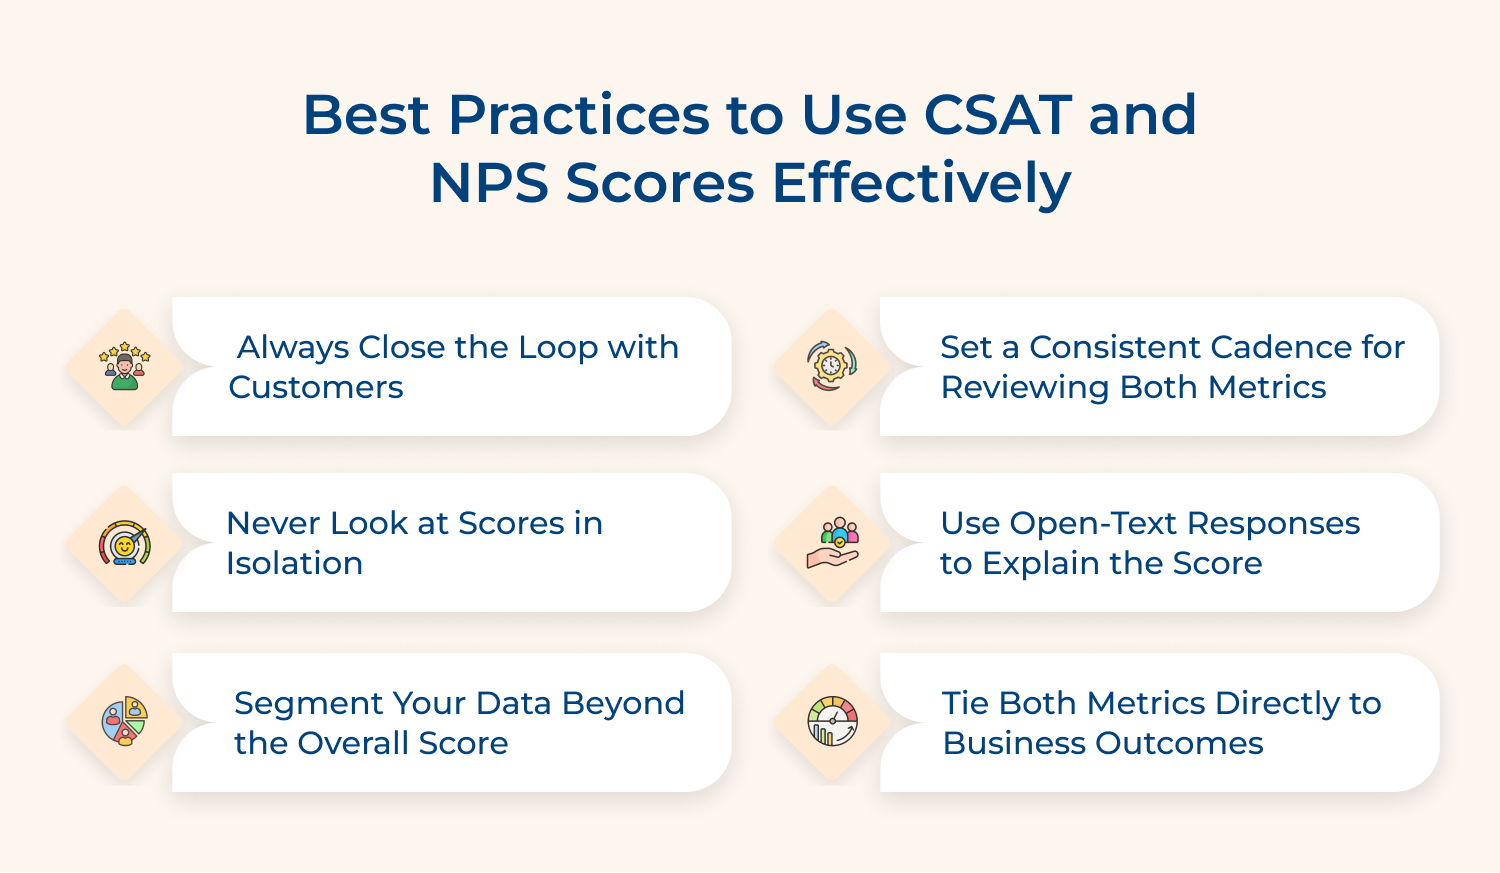
1. Always Close the Loop With Customers
A score without a follow-up is a missed opportunity. When a customer takes the time to respond — reach out, acknowledge their feedback and tell them what you are doing about it.
2. Never Look at Scores in Isolation
A single data point means nothing without context. Always pair your CSAT and NPS scores with operational metrics like churn rate, repeat contacts and resolution time to get the full picture.
3. Segment Your Data Beyond the Overall Score
An average score hides more than it reveals. Break your data down by channel, team, customer segment and journey stage that is where the real patterns and opportunities live.
4. Set a Consistent Cadence for Reviewing Both Metrics
Data that is not reviewed regularly loses its value fast. Build a fixed rhythm weekly CSAT reviews for frontline teams and monthly NPS reviews for leadership to track trends over time.
5. Use Open-Text Responses to Explain the Score
Numbers tell you what happened but customer comments tell you why. Make open-text analysis a non-negotiable part of your review process to uncover the root causes behind every score shift.
6. Tie Both Metrics Directly to Business Outcomes
Scores that exist only on a dashboard rarely drive change. Connect your CSAT and NPS performance to revenue, retention and referral data so every stakeholder understands the real cost of a poor experience.
The right metric depends on what decision you are trying to make and when you need to make it.
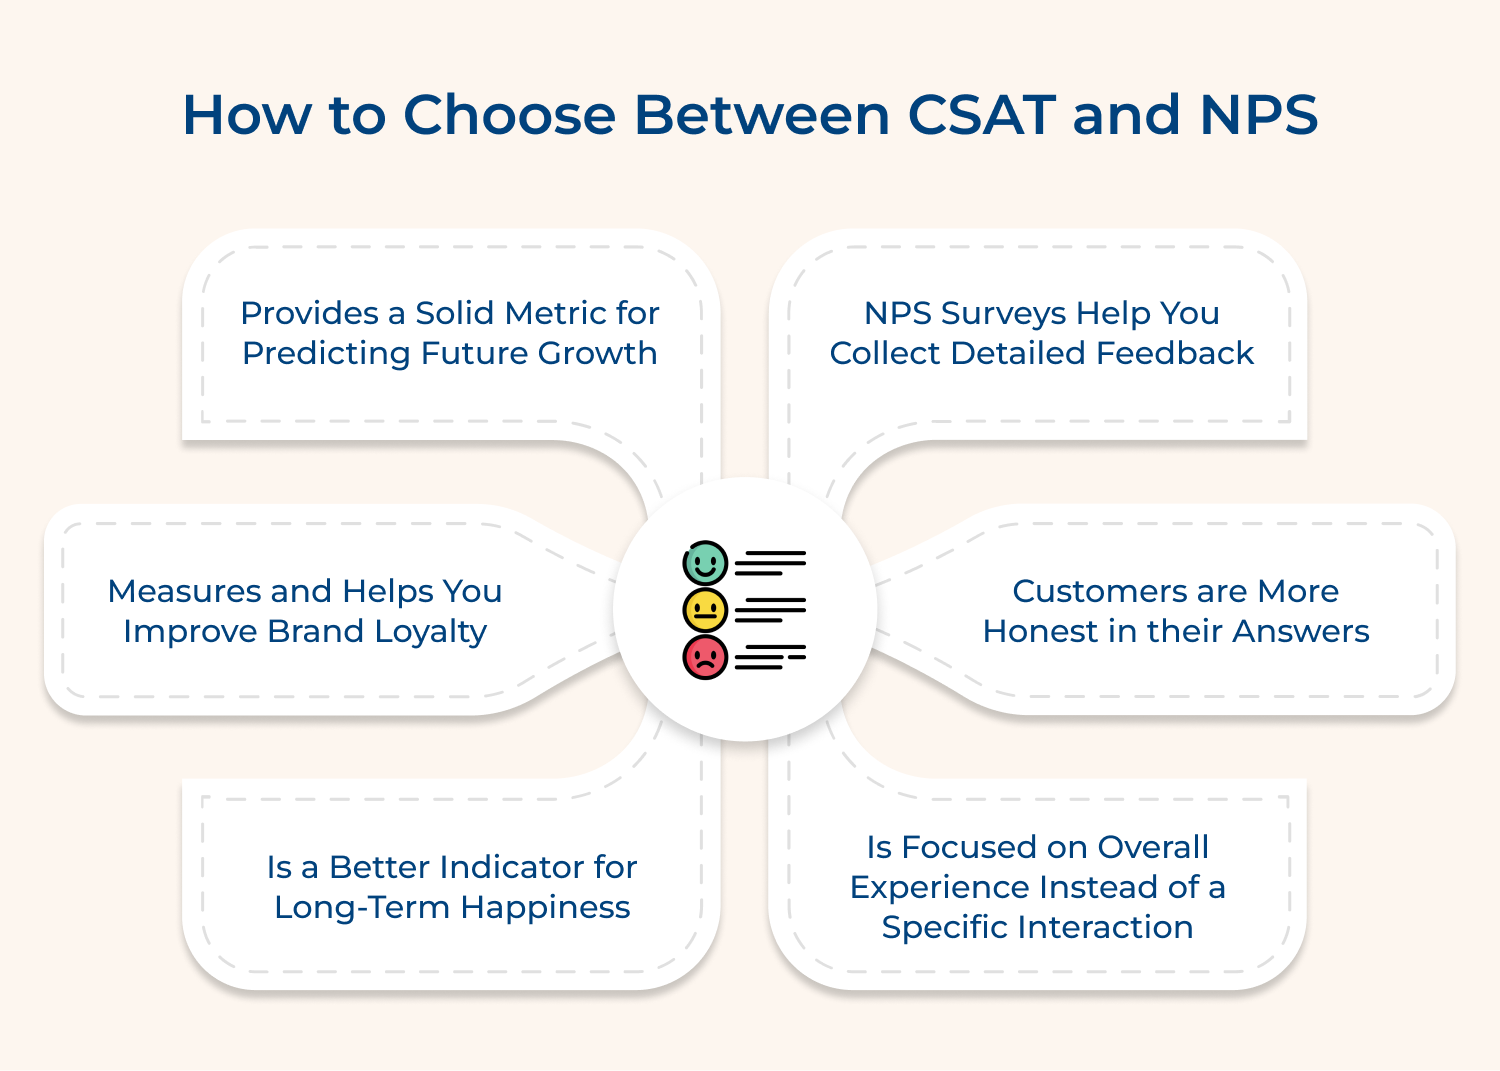
CSAT tells you where your experience is breaking down. NPS tells you whether your brand has earned genuine loyalty. Together, they give you a complete and honest picture of where you stand.
Do not choose between them, use them with purpose. Act on your CSAT data fast, track your NPS trends consistently and let both metrics drive decisions that actually move your customer experience forward.

Can I use both NPS and CSAT surveys for the same customers?
Yes but be strategic about timing. Send CSAT immediately after a specific interaction and reserve NPS for periodic relationship check-ins so customers do not experience survey fatigue.
Which metric is better for predicting customer churn?
NPS is the stronger churn predictor; a dropping score signals weakening loyalty before a customer leaves. CSAT helps too by flagging poor interactions that quietly push customers toward the exit door.
Do I need separate surveys for NPS and CSAT, or can I combine them?
You can combine them, but it is not always ideal. Separate surveys keep the context clean, the responses more accurate, mixing both questions in one survey can confuse customers and dilute your data.
What are common mistakes when comparing CSAT vs NPS?
The biggest mistake is treating them as competitors rather than complements. Comparing scores directly is also misleading; they measure different things at different points and should never be evaluated on the same scale.
What are the advantages of CSAT vs NPS?
CSAT gives you fast and specific feedback that frontline teams can act on immediately. NPS gives you a broader loyalty signal that helps leadership understand long-term brand health and predict sustainable business growth.
 https://omni24.io/wp-content/uploads/2026/08/AI-Customer-Service-Agents.png
1256
2400
Webvision Solution
https://omni24.io/wp-content/uploads/2023/04/Omni-Logo-1.svg
Webvision Solution2026-09-21 04:48:512026-09-21 04:48:51How to Build an AI Customer Service Agents: 8 Key Steps
https://omni24.io/wp-content/uploads/2026/08/AI-Customer-Service-Agents.png
1256
2400
Webvision Solution
https://omni24.io/wp-content/uploads/2023/04/Omni-Logo-1.svg
Webvision Solution2026-09-21 04:48:512026-09-21 04:48:51How to Build an AI Customer Service Agents: 8 Key Steps https://omni24.io/wp-content/uploads/2026/08/Omnichannel-Conversational-AI.png
1256
2400
Tushar Joshi
https://omni24.io/wp-content/uploads/2023/04/Omni-Logo-1.svg
Tushar Joshi2026-09-16 03:51:072026-09-16 03:51:07How to Build Omnichannel Conversational AI Strategy
https://omni24.io/wp-content/uploads/2026/08/Omnichannel-Conversational-AI.png
1256
2400
Tushar Joshi
https://omni24.io/wp-content/uploads/2023/04/Omni-Logo-1.svg
Tushar Joshi2026-09-16 03:51:072026-09-16 03:51:07How to Build Omnichannel Conversational AI Strategy https://omni24.io/wp-content/uploads/2026/08/Customer-Service-Teams.png
1256
2400
Tushar Joshi
https://omni24.io/wp-content/uploads/2023/04/Omni-Logo-1.svg
Tushar Joshi2026-09-15 04:01:522026-09-15 04:02:16How to Build Customer Service Teams: 6 Key Steps
https://omni24.io/wp-content/uploads/2026/08/Customer-Service-Teams.png
1256
2400
Tushar Joshi
https://omni24.io/wp-content/uploads/2023/04/Omni-Logo-1.svg
Tushar Joshi2026-09-15 04:01:522026-09-15 04:02:16How to Build Customer Service Teams: 6 Key Steps
Whether it’s about acquire, engage or support – Omni24 covers all your customer engagement needs in one complete platform.

Copyright ©2026 Veemo All rights reserved.
CA, Los Angeles, Hall Ave, 19011