A Complete Guide of Help Desk Analytics for Businesses

Discover key help desk analytics to track performance, improve response times, boost customer satisfaction, and optimize your support operations for better results.

No Credit Card Needed | Guided Setup

Features - Helpdesk Analytics

Trusted by Customer Centric Businesses acoss The Globe

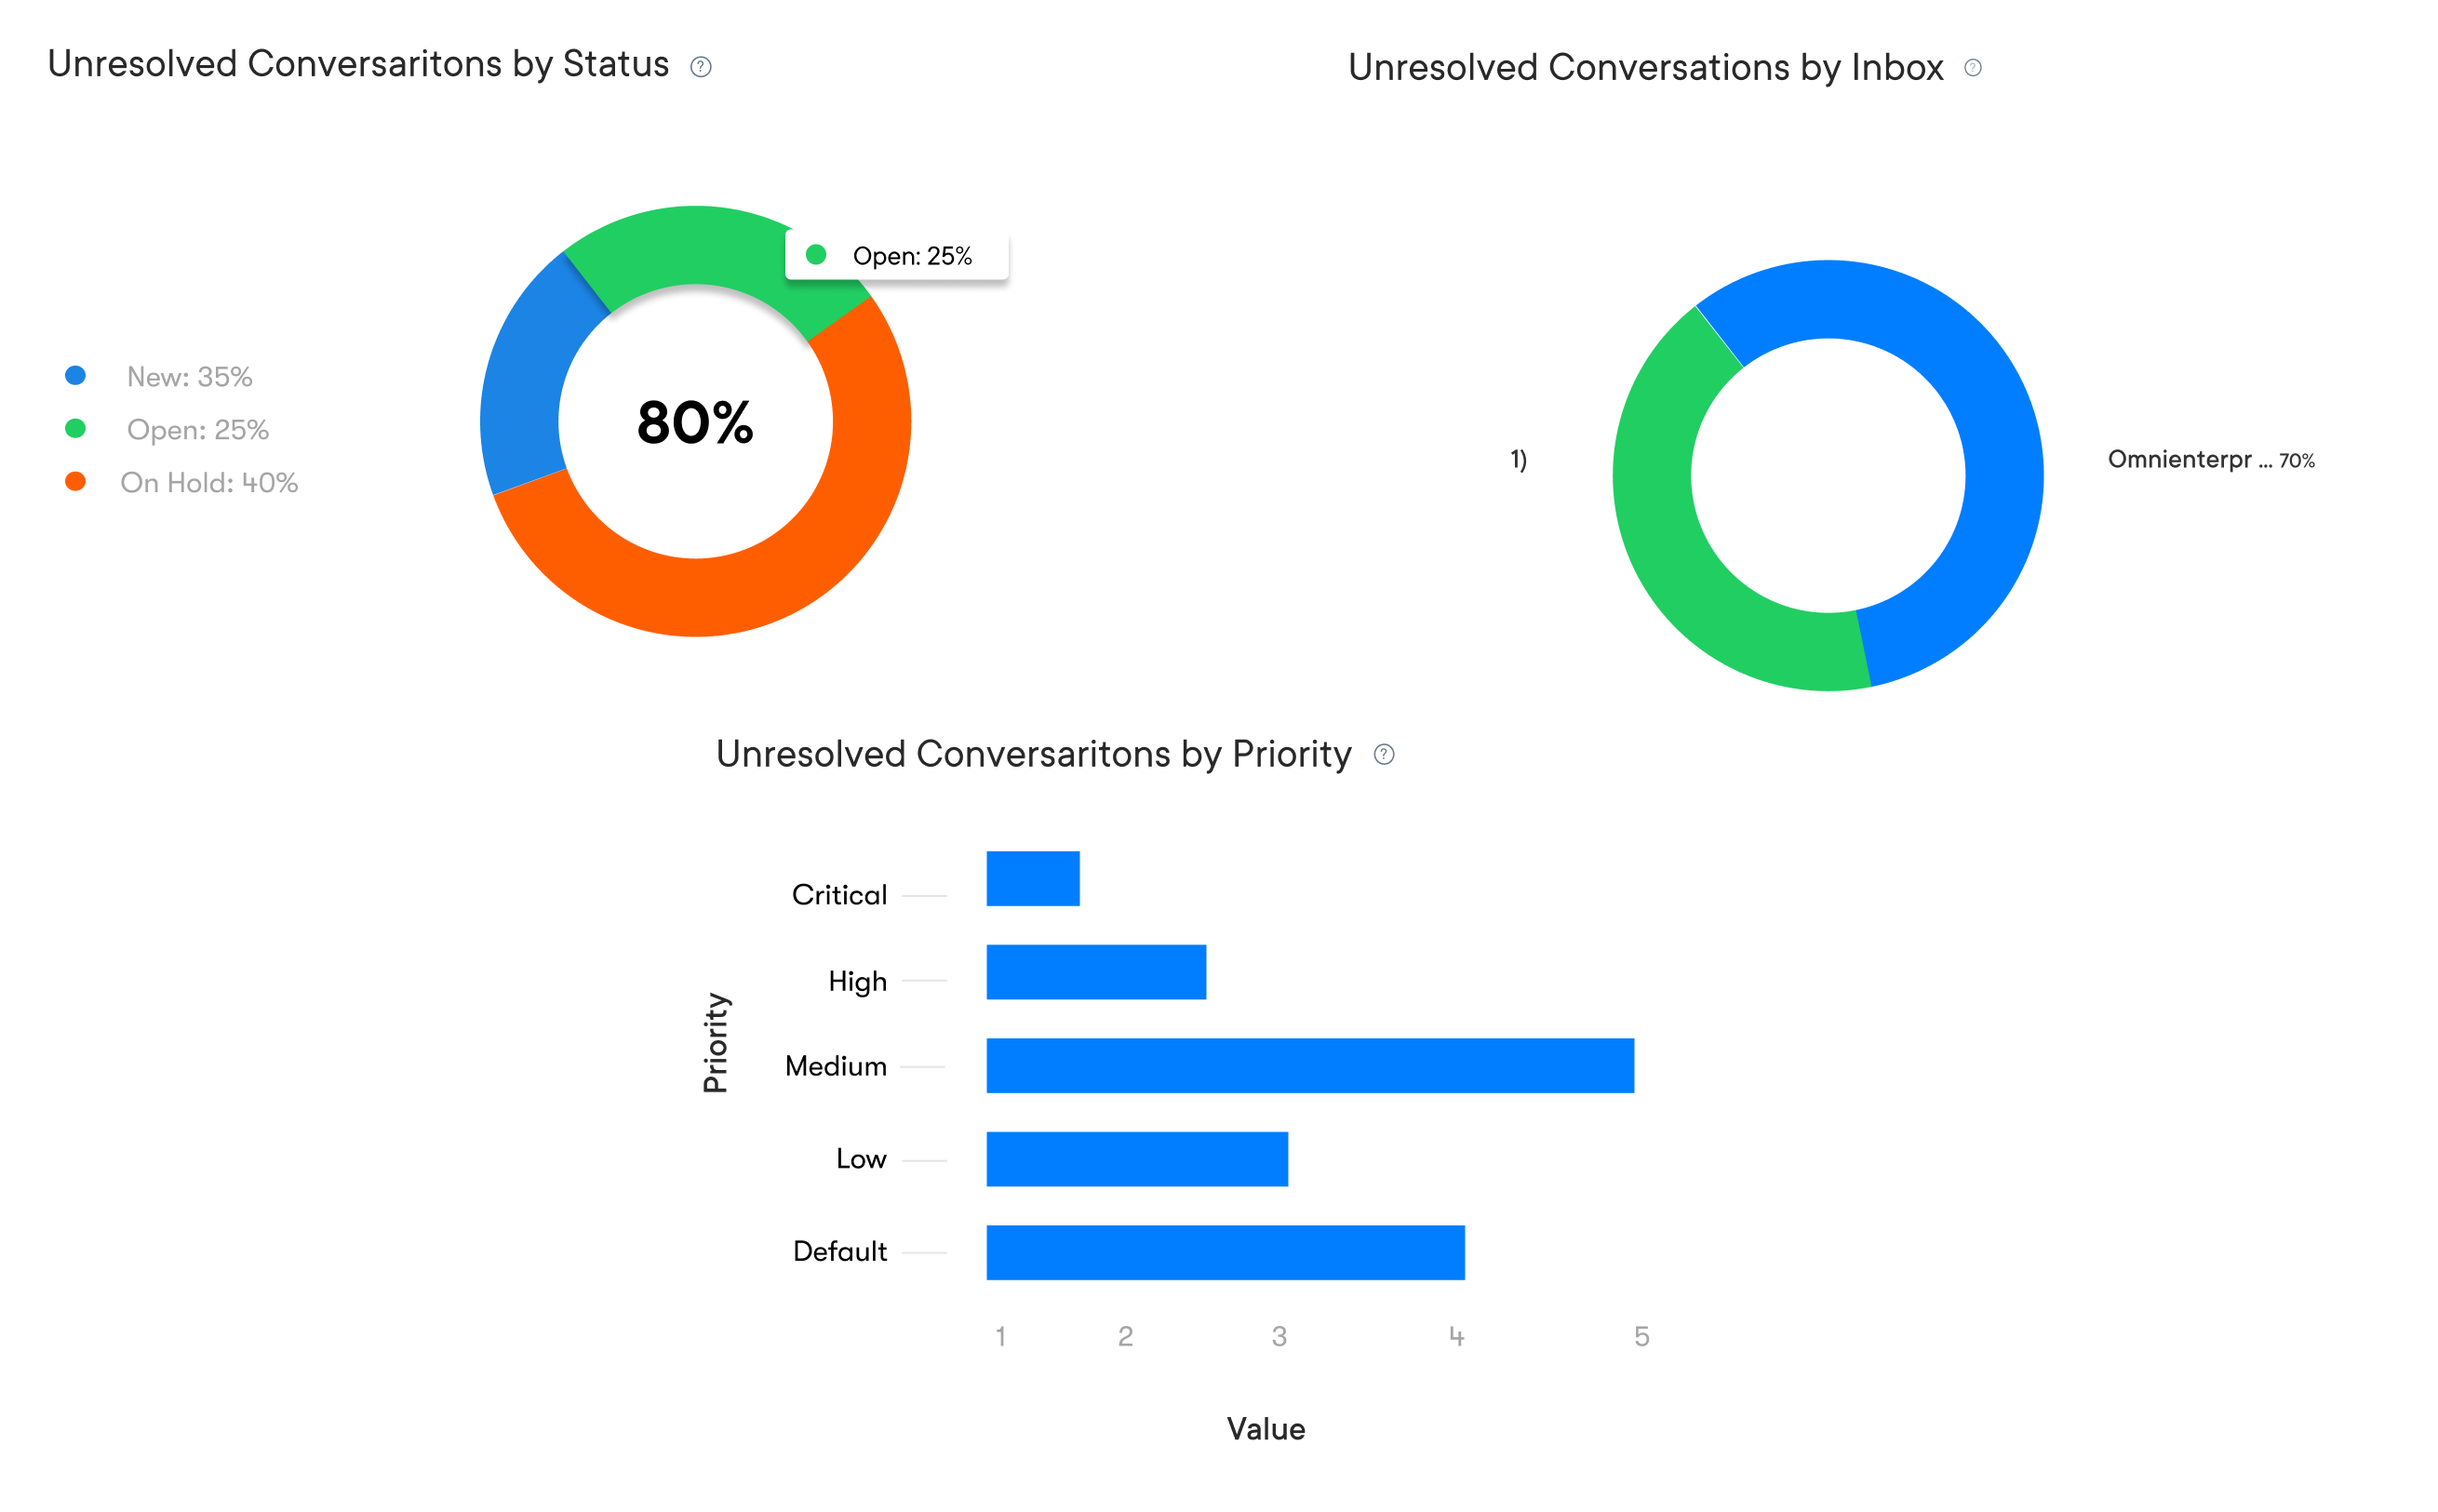
Deliver More Efficient Customer Service Using Helpdesk Dashboard

Helpdesk insights provides understanding on user interactions, response times, and how quickly tickets get resolved.

  • Improved Customer Satisfaction

    Analyze customer interactions with the help of helpdesk analytics and identify customer complaints. Enable support teams to address recurring problems more effectively and, leading to faster resolutions and higher customer satisfaction.

  • Data-Driven Decision Making

    Gain actionable insights that can help make informed and strategic decisions. By making decisions based on real data, organizations can better align their support strategies with customer needs and business goals.

  • Proactive Resolution of Issues

    Help desk dashboard can predict potential issues before they escalate by analyzing historical data and identifying patterns. Proactive issue resolution reduces downtime and enhances the customer experience

  • Enhanced Agent Performance

    Helpdesk analytics can track key KPIs for support agents, like average response time, resolution time and first contact resolution rate. Identify top-performing agents and those who need training to tailor training programs. It leads to effective support, improving service quality.

  • Optimized Resource Allocation

    Help desk analytics highlight areas where resources are over or under-utilized, allowing businesses to allocate staff effectively, ensuring timely responses and balanced workloads.

  • Continuous Process Improvement

    By tracking recurring issues and analyzing customer feedback, help desk analytics provide valuable insights to refine processes, eliminate inefficiencies, while enhancing overall service delivery.

Helpdesk analytics is revolutionizing customer support by transforming raw data into actionable insights. The powerful tool allows businesses to optimize their support operations, enhance customer satisfaction and drive operational efficiency.

If you’re a small startup or a large enterprise, understanding and leveraging help desk analytics can be the key to elevating your customer support to new heights.

Let’s explore the fundamentals of helpdesk analytics, its benefits, essential metrics to track and best practices for implementation.

Help desk Analytics: Definition

Help desk analytics refers to the process of collecting, analyzing as well as interpreting data from help desk operations to improve service quality, efficiency and overall performance. It involves using various tools and techniques to extract insights from ticket data, customer interactions as well as support team activities.

Help desk analytics is important because of its ability to take data-informed decisions that improve service quality and enhance customer satisfaction. Organizations can optimize their support operations proactively address customer needs by identifying trends and areas for improvement.

  • Performance measurement: Tracking key metrics such as response times, resolution rates and customer satisfaction scores to evaluate the effectiveness of the help desk.
  • Trend identification: Analyzing patterns in support requests to identify recurring issues, peak times and emerging problems, enabling proactive problem-solving.
  • Resource optimization: Using data to optimize staffing levels, allocate resources efficiently and identify areas where automation can be implemented.
  • Continuous improvement: Leveraging insights to refine processes, enhance training programs and make data-driven decisions for ongoing service improvement.

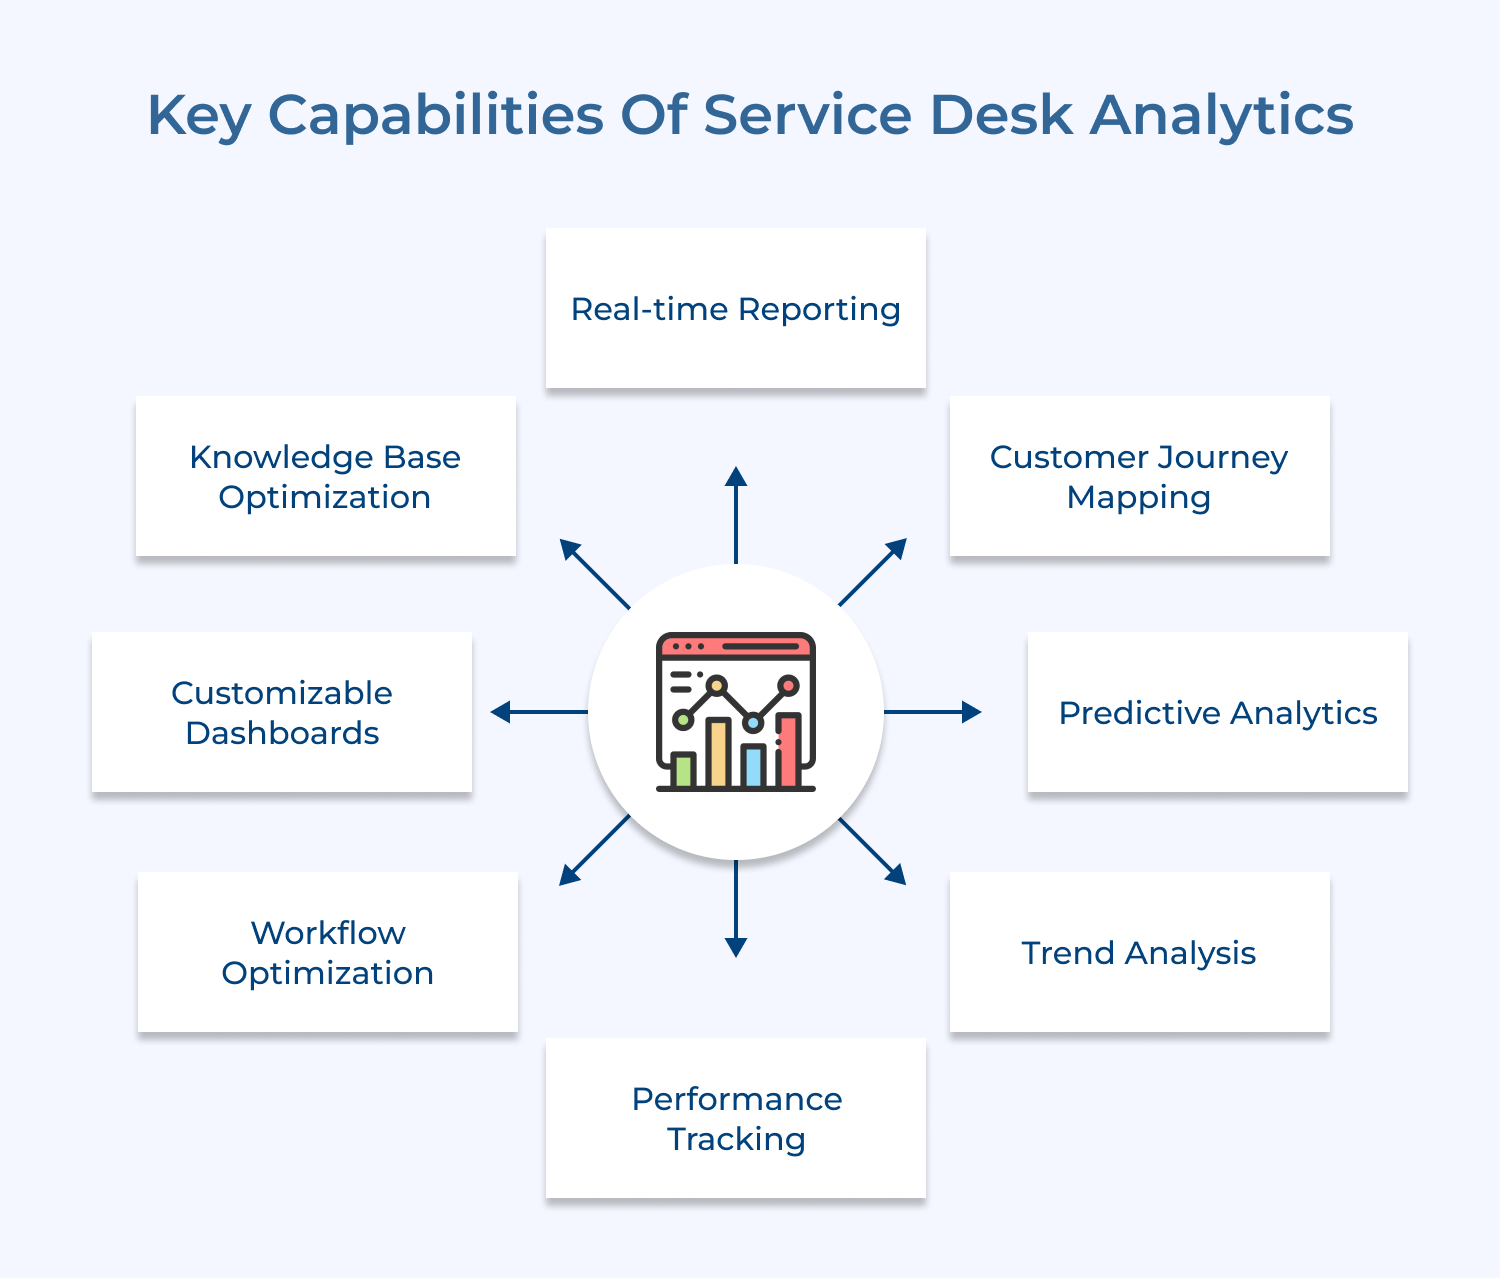
Key Capabilities of Service Desk Analytics

Help desk analytics offers essential capabilities to track, measure, and improve customer support performance. Explore the capabilities and how it elevates customer service.

Key Capabilities of Service Desk Analytics

1. Real-time Reporting

Real-time reporting provides up-to-the-minute information on various aspects of support operations. It allows managers and team leaders to monitor current performance, identify emerging issues as well as make quick decisions to address problems as they arise.
Real-time reports can include metrics such as active ticket count, average response time, and agent availability. By having access to this immediate data, support teams can proactively manage workloads, allocate resources effectively and ensure that service level agreements (SLAs) are met consistently.

2. Customer Journey Mapping

Mapping customer journey visualizes the entire customer experience from initial contact through to issue resolution. It allows support teams to understand the various touchpoints a customer encounters during their interaction with the service desk.
Mapping out journeys, businesses can identify pain points and areas where the customer experience can be improved. The insight enables teams to streamline processes, reduce friction in customer interactions and enhance overall satisfaction. It also reveals opportunities for proactive support interventions and personalized service delivery.

3. Predictive Analytics

Predictive Analytics uses historical data and machine learning algorithms to forecast future trends. It enables support teams to anticipate problems before they occur, allowing for proactive measures to be implemented.
For example, predictive analytics can forecast peak periods of ticket volume, enabling managers to adjust staffing levels accordingly. It can also identify patterns that may lead to customer churn, allowing for targeted retention efforts. By leveraging predictive analytics, service desks can shift from a reactive to a proactive support model, improving efficiency and customer satisfaction.

4. Trend Analysis

Trend analysis involves examining historical data to identify patterns and trends over time. It helps support teams understand long-term changes in ticket volumes, types of issues, customer behavior and support performance. By recognizing these trends, businesses can make informed decisions about resource allocation, training needs and process improvements.
Trend analysis also highlights seasonal variations in support demands, recurring issues that may require systemic solutions and shifts in customer preferences for support channels.

5. Performance Tracking

Performance tracking allows businesses to monitor and measure the effectiveness of their support operations. It includes tracking individual agent performance, team productivity and overall service desk efficiency.
Key performance indicators (KPIs) such as average handling time, first contact resolution rate and customer satisfaction scores are continuously analyzed. It enables managers to identify top performers, recognize areas for improvement and implement targeted training programs. Performance tracking also facilitates data-driven performance evaluations and helps in setting realistic goals for the support team.

6. Workflow Optimization

Workflow Optimization leverages analytics to identify inefficiencies in support processes and suggest improvements. It analyzes the flow of tickets through the support system, identifying steps, or areas where automation could be beneficial.
Optimizing workflows helps helpdesks reduce resolution times, minimize errors and improve overall efficiency. It involves automating ticket routing, streamlining escalation processes, or implementing AI-powered chatbots. Workflow optimization ensures that support resources are used effectively and that customers receive faster, more efficient service.

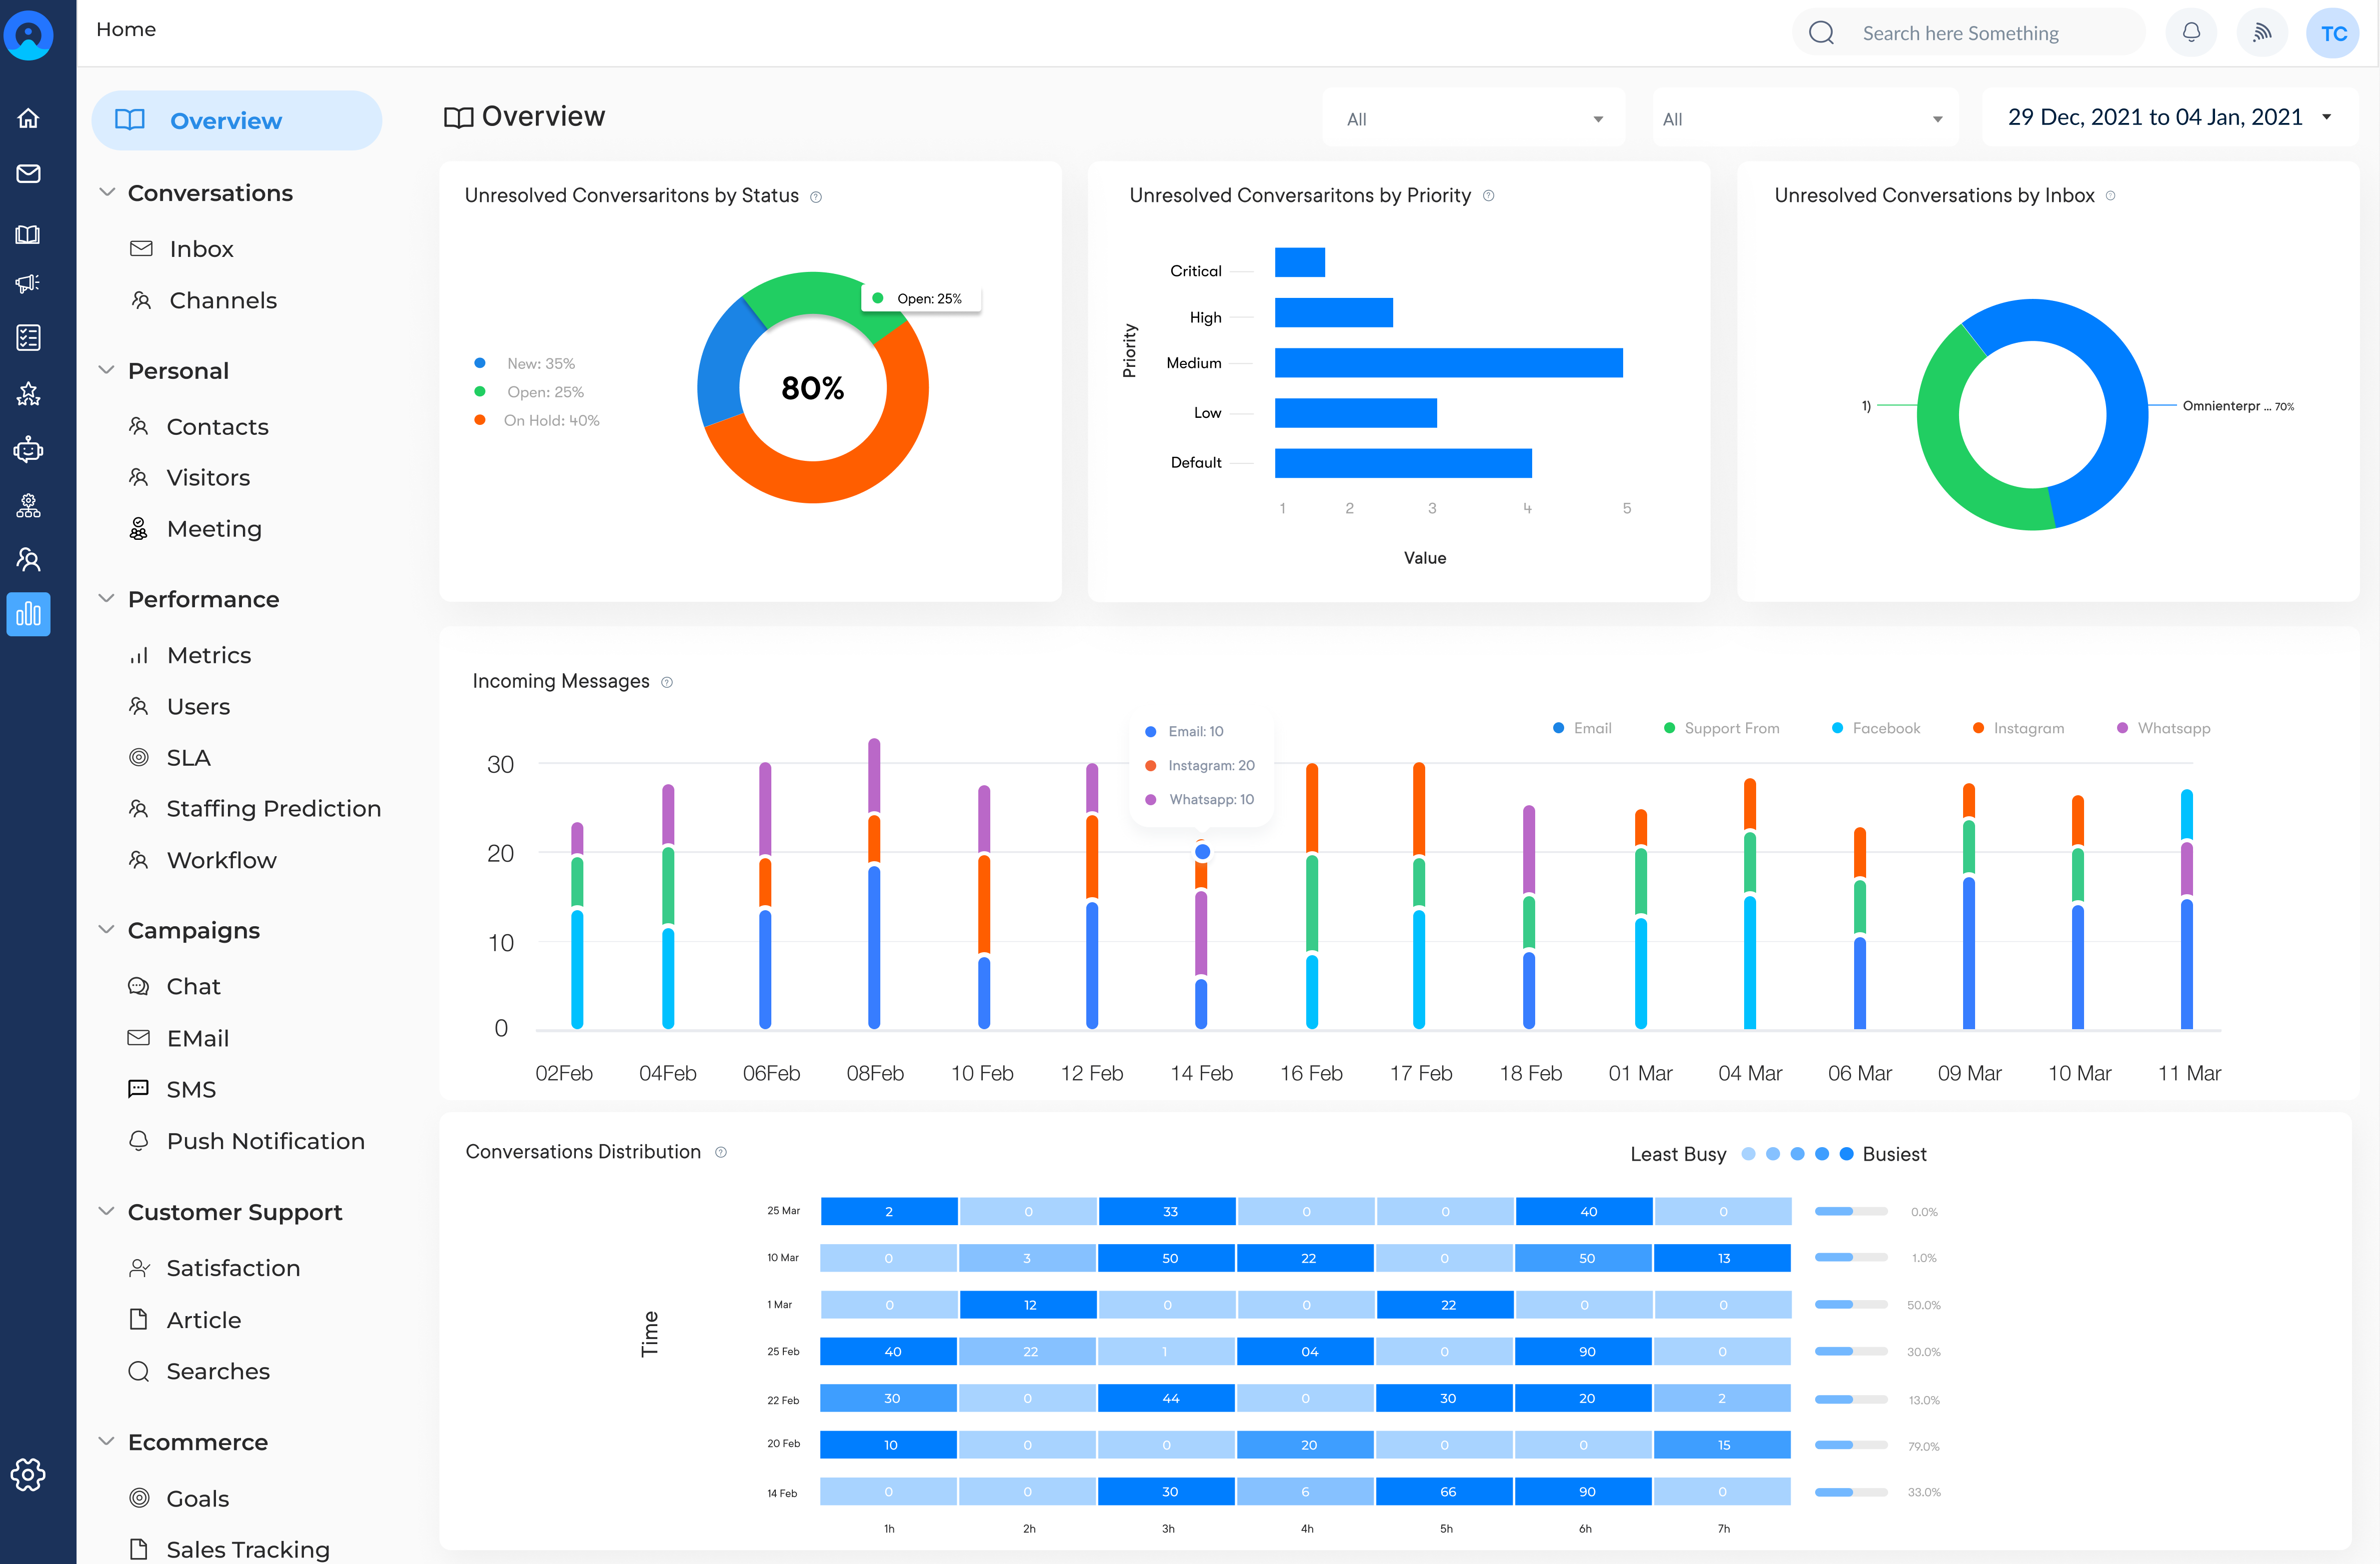
7. Customizable Dashboards

Customizable Dashboards provide a visual representation of key metrics and performance indicators tailored to the specific needs of different users. It allows managers, agents and executives to create personalized views of the data most relevant to their roles.
For example, a support agent might have a dashboard focused on their individual performance and current ticket queue, while a manager’s dashboard might display team-wide metrics as well as SLA compliance rates. Customizable dashboards enable quick access to critical information, facilitate data-driven decision-making at all levels and promote transparency across the organization.

8. Knowledge Base Optimization

Knowledge Base optimization uses analytics to improve the effectiveness of self-service support resources. It analyzes user interactions, identifying frequently accessed articles, search patterns and gaps in available information. By understanding how customers use the knowledge base, businesses can continually refine and expand their self-service content. It might involve creating new articles on common issues, improving the searchability of existing content or restructuring information for easier navigation.
An optimized knowledge base can significantly reduce ticket volumes by enabling customers to find solutions independently, while also empowering support agents with readily accessible information for faster issue resolution.
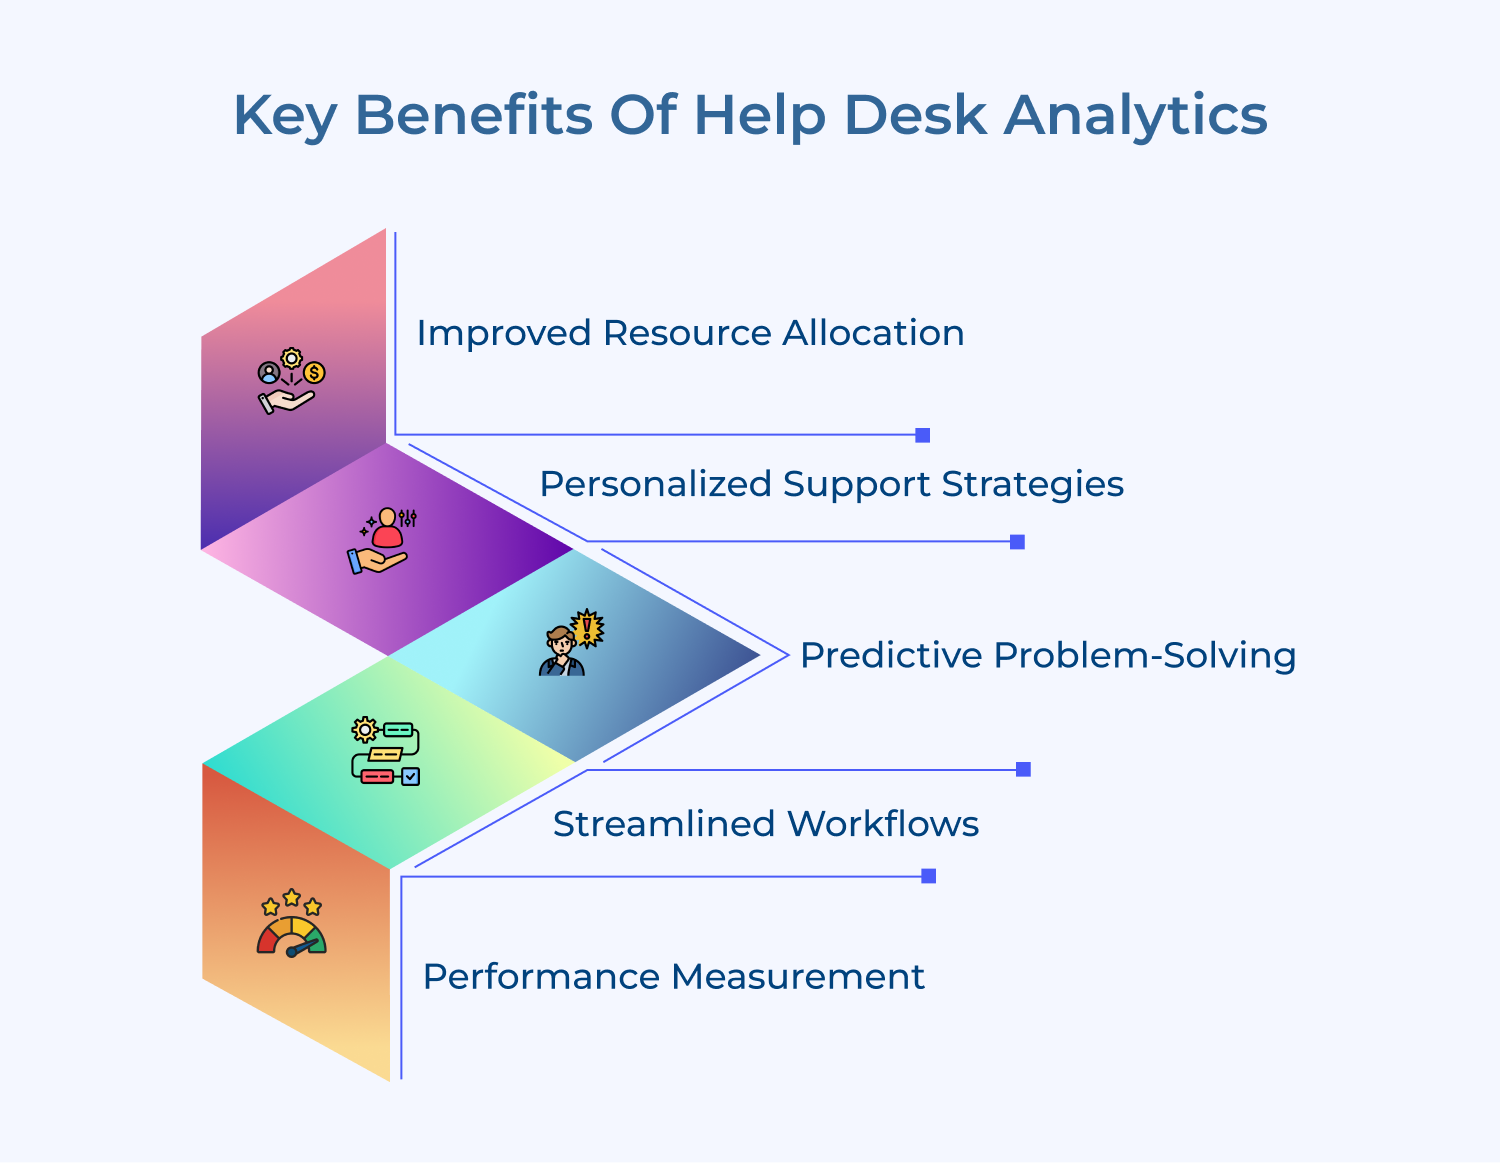
Key Benefits of Help Desk Analytics

One way to ensure that helpdesk analytics is operating effectively and meeting customer needs is through the use of help desk analytics. Let’s get into how it benefits the business.

Key Benefits of Help Desk Analytics
  • Improved resource allocation: Analytics provide insights into ticket volumes, peak times and agent workloads. The data enables managers to allocate staff more effectively, ensuring adequate coverage during busy periods and optimizing team efficiency.
  • Personalized support strategies: By analyzing customer interaction history and preferences, support teams can tailor their approach to each user. Such personalization leads to faster issue resolution and improved customer satisfaction.
  • Predictive problem-solving: Analytics can identify patterns in support tickets, allowing teams to anticipate and address potential issues before they escalate. The proactive approach reduces ticket volumes and improves overall system reliability.
  • Streamlined workflows: Data-driven insights help identify inefficiencies in support processes. Teams can then refine their workflows, automating repetitive tasks and focusing on high-value activities that require human expertise.
  • Performance measurement: Analytics provide clear metrics for evaluating individual and team performance. The data helps in setting realistic KPIs, recognizing top performers, and identifying areas for improvement.

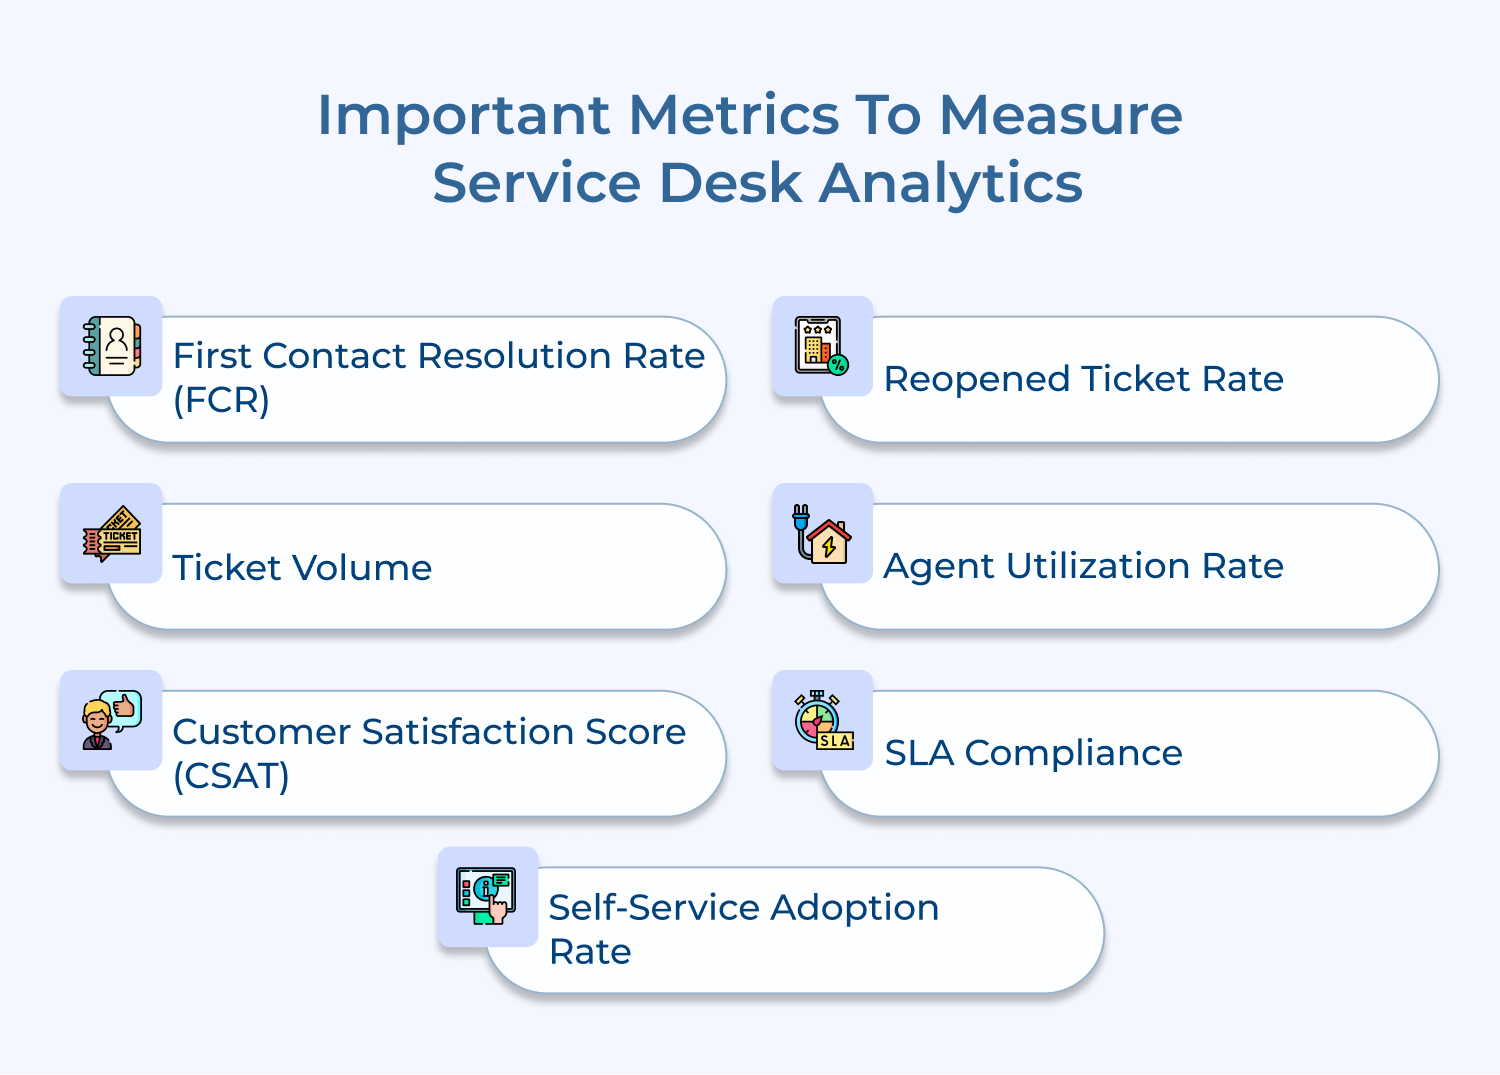
Important Metrics to Measure Service Desk Analytics

Measuring the effectiveness of your service desk is essential for improving customer satisfaction and overall efficiency.

Important Metrics to Measure Service Desk Analytics

First Contact Resolution Rate (FCR)

FCR measures the percentage of issues resolved during the customer’s first contact with the service desk. The metric is crucial as it directly impacts customer satisfaction and operational efficiency. A high FCR indicates that agents are knowledgeable and empowered to solve problems quickly.
To calculate FCR, divide the number of tickets resolved on first contact by the total number of tickets, then multiply by 100. Improving FCR often involves enhancing agent training, updating knowledge bases and empowering agents with the right tools as well as authority to resolve issues.

Ticket Volume

The ticket volume metric tracks the total number of support tickets received over a specific period. It’s a fundamental measure that helps in resource planning and identifying trends. Analyzing ticket volume by time (hourly, daily, weekly, monthly) can reveal patterns, allowing managers to staff appropriately for peak times.
A sudden increase in ticket volume might indicate a system-wide issue or a need for proactive customer education. Conversely, a decrease could suggest improved product stability or effective self-service options.

Customer Satisfaction Score (CSAT)

CSAT is a direct measure of how satisfied customers are with the service they receive. It’s typically measured through post-interaction surveys, asking customers to rate their experience on a scale (e.g., 1-5 or 1-10).
To calculate CSAT, divide the number of satisfied customers (usually those who select 4 or 5 on a 5-point scale) by the total number of respondents, then multiply by 100. CSAT is crucial for understanding the quality of service from the customer’s perspective and can highlight areas needing improvement.

Reopened Ticket Rate

The reopened ticket rate metric measures the percentage of tickets that are reopened after being marked as resolved. A high reopened ticket rate suggests that issues are not being fully or correctly resolved on the first attempt. To calculate, divide the number of reopened tickets by the total number of closed tickets, then multiply by 100.
A low rate indicates effective problem-solving and thorough issue resolution. High rates might point to the need for additional agent training, more comprehensive troubleshooting processes, or improvements in the knowledge base.

Agent Utilization Rate

The agent utilization rate metric shows how efficiently agents’ time is being used. It’s calculated by dividing the time agents spend on ticket-related activities by their total available time, then multiplying by 100.
While a high utilization rate might seem desirable, extremely high rates (over 80-85%) can lead to burnout and decreased service quality. Conversely, low rates might indicate overstaffing or inefficient processes. Optimal utilization varies by industry and company, but generally falls between 70-80%.

SLA Compliance

Service Level Agreement (SLA) compliance measures how well the service desk is meeting its promised service levels. This could include metrics like time to first response, time to resolution, or availability of service.
SLA compliance is typically expressed as a percentage – the number of SLA-compliant tickets divided by the total number of tickets, multiplied by 100.
High SLA compliance indicates reliability and can boost customer trust. Low compliance might suggest the need for process improvements, additional resources, or more realistic SLA targets.

Self-Service Adoption Rate

The metric tracks how often customers successfully use self-service options (like knowledge bases or chatbots) to resolve their issues without needing agent intervention.
Calculate it by dividing the number of self-service interactions by the total number of support interactions (self-service + agent-assisted), then multiplying by 100.
A high adoption rate can significantly reduce ticket volume and costs while improving customer satisfaction through instant issue resolution. Low rates might indicate that self-service options are not user-friendly, comprehensive, or well-promoted.

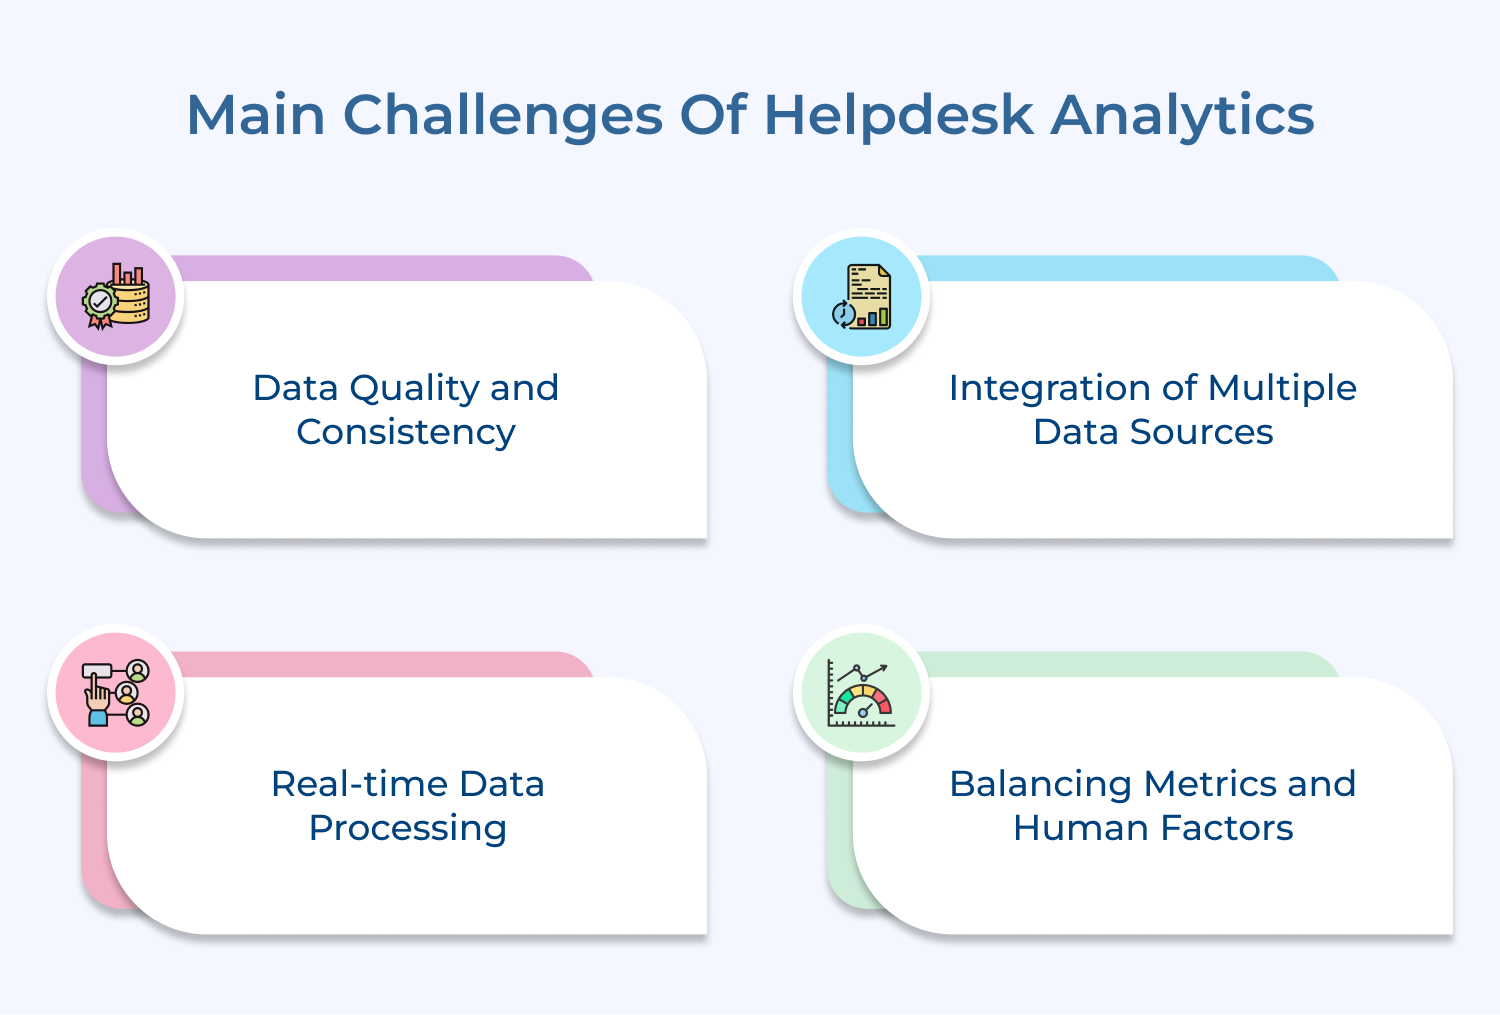
Main Challenges of Helpdesk Analytics

Helpdesk analytics is the process of interpreting data from customer support interactions. However it come with challenges. Let’s look into them while also finding for solutions.

Main Challenges of Helpdesk Analytics
  • Data Quality and Consistency: Inconsistent data entry, incomplete tickets or incorrect categorization can lead to skewed analytics and unreliable insights. The issue is often exacerbated by manual data entry processes and varying practices among different agents. Maintaining high data quality requires ongoing training, clear guidelines and regular audits to ensure all team members are following standardized procedures.
  • Integration of Multiple Data Sources: Modern helpdesks often use various tools and platforms, each generating its own set of data. Integrating these diverse data sources into a cohesive analytics system can be technically challenging. Ensuring that data from different channels and tools can be combined holistically is crucial for comprehensive insights but often requires significant resources.
  • Real-time Data Processing: The ability to process and analyze data in real-time is increasingly important for proactive issue resolution as well as dynamic resource allocation. But, implementing real-time analytics capabilities can be technically complex and resource-intensive, especially for organizations dealing with high volumes of data or using legacy systems.
  • Balancing Metrics and Human Factors: While metrics are crucial for measuring performance, over-reliance on quantitative data can lead to a neglect of important qualitative factors. For instance, focusing solely on metrics like ticket resolution time might incentivize quick but superficial solutions, potentially sacrificing customer satisfaction. Striking the right balance between quantitative metrics and qualitative assessments is an ongoing challenge.

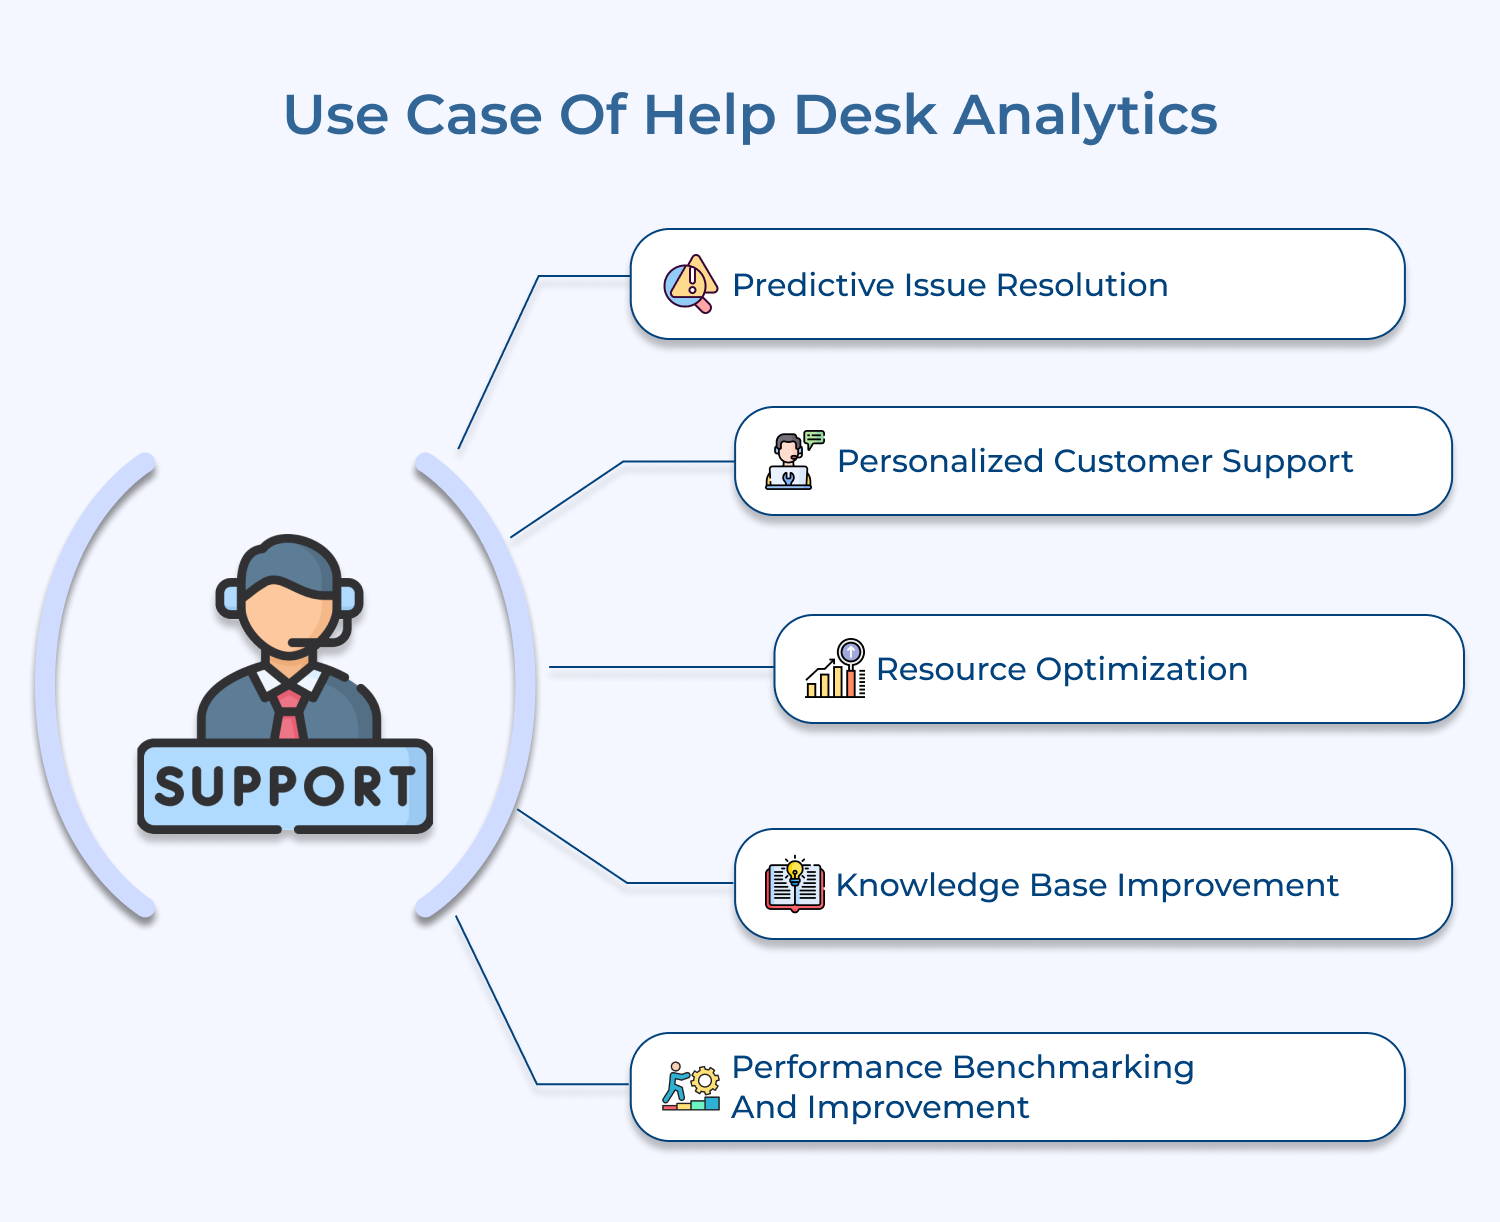
Use Case of Help Desk Analytics

Help desk analytics have become an essential tool for organizations looking to improve their operations. Here are some use cases for your consideration.

Use Case of Help Desk Analytics
  • Predictive Issue Resolution: Helpdesk analytics can be used to predict and prevent issues before they occur. By analyzing historical data patterns, organizations can identify recurring problems and their root causes.
    For instance, if analytics show that a particular software update consistently leads to a spike in specific types of tickets, the IT team can proactively prepare solutions or even prevent the issue altogether. The predictive approach not only reduces ticket volume but also improves customer satisfaction by minimizing downtime and frustration.
  • Case to the point: A software company uses analytics to predict that a new feature release will likely cause a 30% increase in password reset requests. They preemptively bulk up support staff and create targeted FAQ resources, successfully managing the influx without impacting overall service quality.
  • Personalized Customer Support: Analytics can provide insights into individual customer histories, preferences and behaviors. The information allows support teams to tailor their approach to each customer, providing more personalized and effective service. By analyzing past interactions, common issues and resolution methods, agents can offer solutions that are more likely to satisfy the customer quickly.
  • Case to the point: A telecom company’s analytics system flags a customer who has contacted support multiple times about slow internet speeds. The next time they call, the system automatically routes them to a senior technician specialized in connectivity issues, leading to faster resolution and improved customer satisfaction.
    Resource Optimization: By analyzing ticket volumes, resolution times and agent performance metrics, organizations can optimize their resource allocation. It includes staffing decisions, training programs and workload distribution. Analytics can reveal peak hours, busiest days and seasonal trends, allowing managers to schedule staff more effectively.
  • Case to the point: A retail company’s help desk analytics show that ticket volume increases by 200% during holiday sales. They use this data to implement a flexible staffing model, bringing in temporary support during peak periods and offering overtime to regular staff, ensuring consistent service quality despite the volume increase.
  • Knowledge Base Improvement: Analytics can identify gaps in the existing knowledge base by analyzing frequently asked questions, common issues and search queries that don’t yield results. This information can be used to create new articles, update existing ones and improve the overall structure of the knowledge base, enhancing self-service options for customers.
  • Case to the point: A software company’s analytics reveal that 40% of tickets relate to a specific feature, but the knowledge base lacks comprehensive information on this topic. They create a detailed guide and video tutorial, resulting in a 25% reduction in related tickets.
  • Performance Benchmarking and Improvement: Analytics provide concrete data for benchmarking performance against industry standards or internal goals. By tracking key metrics like first contact resolution rate, average handling time and customer satisfaction scores, organizations can identify areas for improvement and set realistic targets. The data-driven approach to performance management can motivate teams and drive continuous improvement.
  • Case to the point: A multinational corporation uses analytics to compare help desk performance across different regional offices. They identify that the Asia-Pacific office consistently achieves a 15% higher first contact resolution rate. By analyzing their processes and implementing best practices across all regions, they improve overall performance as well as standardize service quality globally.

Gain Valuable Insights with Help Desk Analytics

Strategic implementation of help desk analytics transforms raw support data into actionable intelligence, driving both operational excellence and enhanced customer experience. Organizations leveraging real-time insights can identify emerging issues, optimize agent performance, and make data-driven decisions that directly impact business growth.

Smart analysis of support metrics enables teams to move from reactive to proactive service delivery. Customer expectations continue to evolve, prompting forward-thinking companies to embrace analytical tools for gaining competitive advantages.

Scale Your Conversations with Omni24’s Digital Customer Experience Platform

Omni24’s DCX platform harnesses automation and AI to deliver unified customer experiences across digital channels, while keeping human touch

Frequently Asked Questions About Helpdesk Analytics

Helpdesk analytics refers to the process of gathering and analyzing data from customer service interactions to improve overall performance. By using data-driven insights, businesses can make informed decisions to optimize their help desk operations and enhance customer satisfaction.

Helpdesk analytics is important for businesses because it allows them to track key metrics such as response times, resolution rates and customer satisfaction scores. By monitoring these metrics, companies can identify areas for improvement, streamline processes and ultimately provide better support to their customers.

Helpdesk analytics can benefit a company’s customer support services by helping them understand customer behavior, preferences and pain points. By analyzing data from customer interactions, businesses can tailor their support strategies to meet the specific needs of their customers, resulting in higher satisfaction levels and loyalty.

Businesses should invest in a helpdesk analytics tool because it provides valuable insights that can drive performance improvements and cost savings. By utilizing a helpdesk analytics tool, companies can gain visibility into key metrics, identify trends and make data-driven decisions to enhance their customer support services.

Helpdesk analytics can help in identifying customer service issues by monitoring metrics such as customer wait times, ticket resolution rates and customer feedback. By analyzing these metrics, businesses can pinpoint common pain points and address underlying issues to improve overall customer satisfaction.

Common metrics used in helpdesk analytics include first response time, average resolution time, customer satisfaction scores, ticket volume and agent performance metrics. By tracking these metrics, businesses can assess the effectiveness of their customer support operations and make data-driven decisions to enhance overall service quality.