Top 11 Customer Engagement Metrics & KPIs to Measure in 2026
This guide covers key user engagement metrics, from CSAT to LTV, offering insights into customer behavior, preferences, and satisfaction.

This guide covers key user engagement metrics, from CSAT to LTV, offering insights into customer behavior, preferences, and satisfaction.
How do you know if your customer engagement strategies are effective? Are your customer engagement metrics effective enough? Does it gauge the success of your efforts?Understanding customer engagement is essential for any business looking to build long-term relationships and drive success.
Many businesses struggle with identifying the most relevant metrics and KPIs to gauge their customer engagement efforts. The right user engagement metrics provide valuable insights into customer behavior as well as preferences, allowing businesses to tailor their strategies and offerings to meet customer needs.
Customer engagement refers to the level of interaction as well as involvement that customers have with a company, its products and its services. It encompasses the various interactions like browsing a website, using a product, receiving customer service as well as providing feedback.
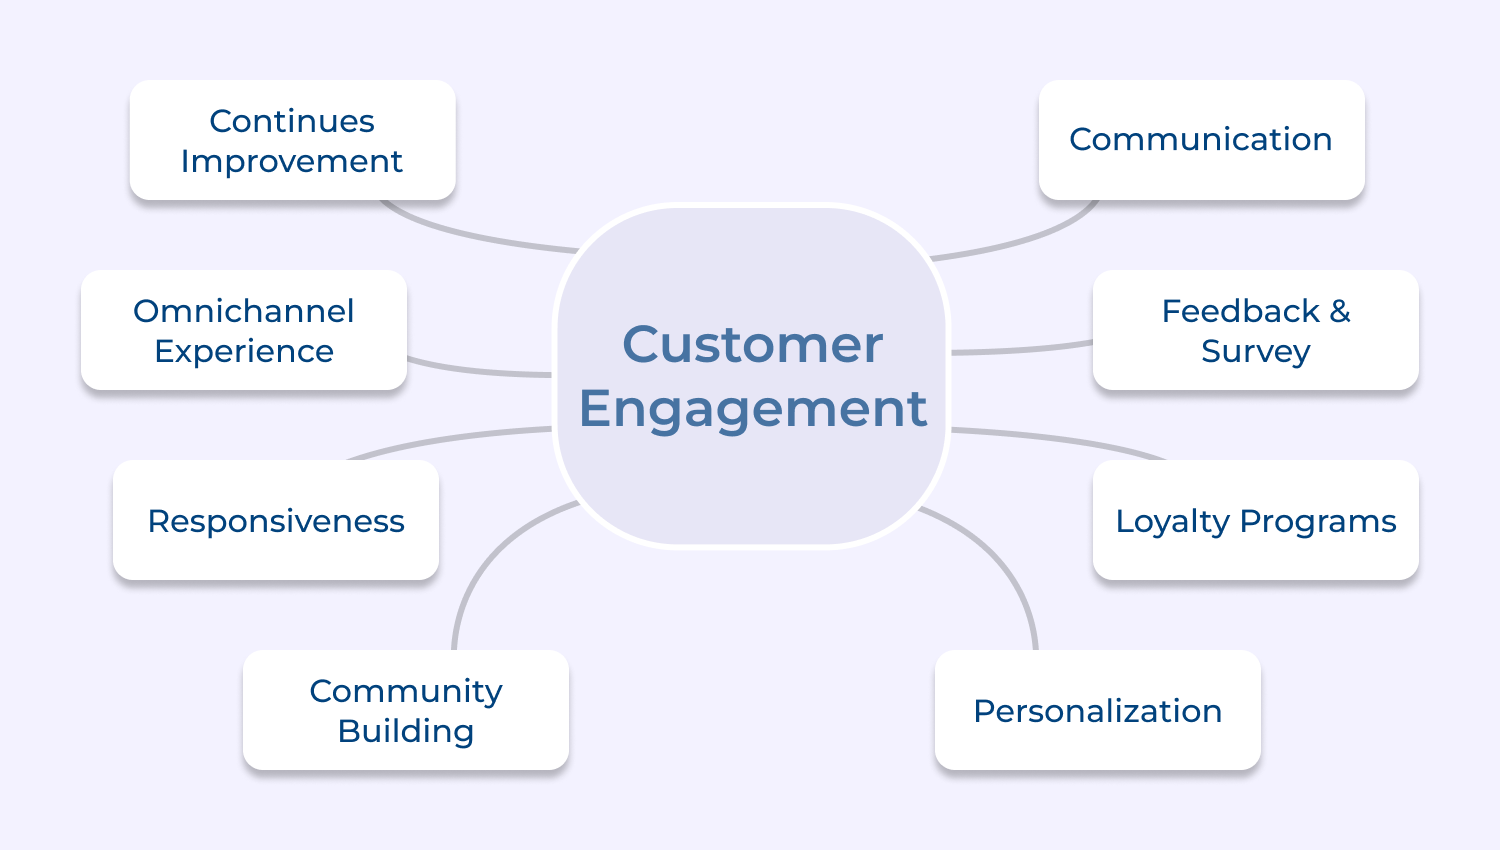
Some examples of customer engagement in business include:
This article explores the benefits of measuring these metrics and why integrating them into your business strategy could be the catalyst for sustainable success.
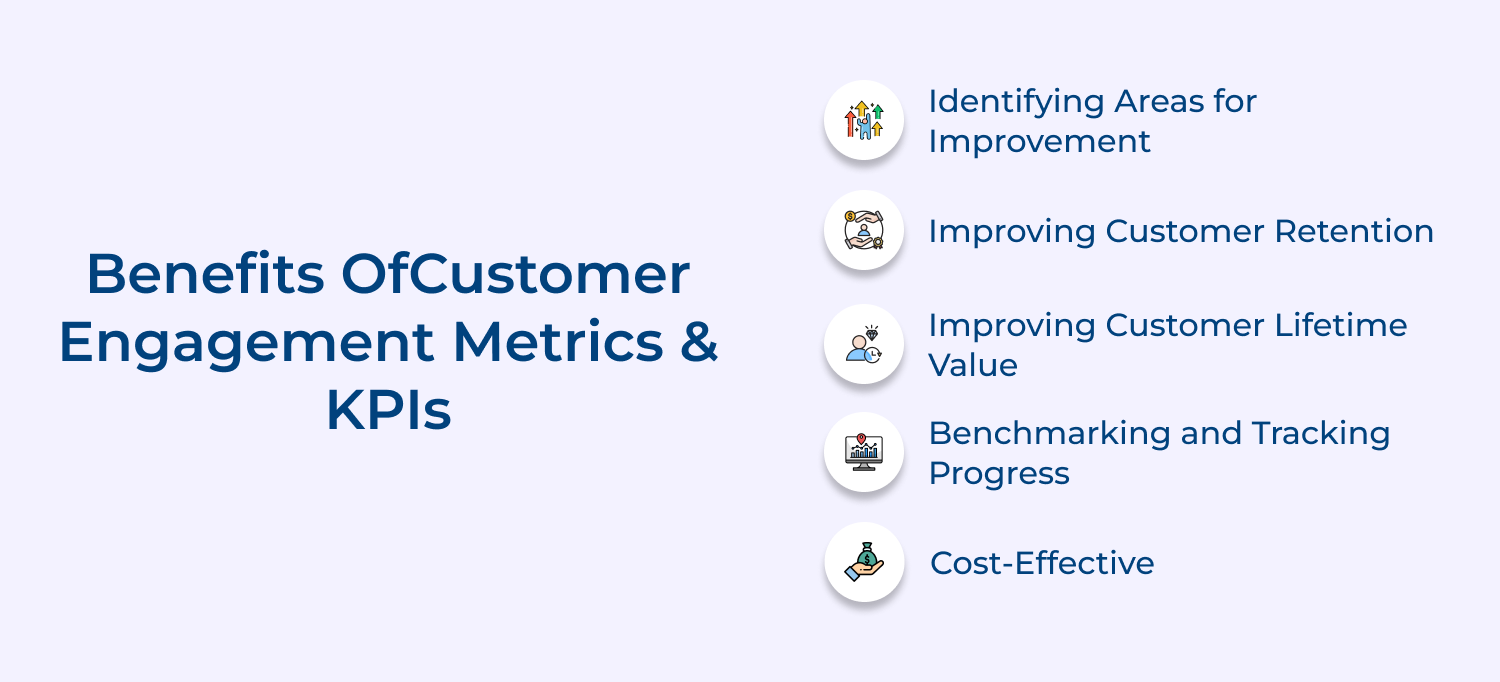
1. Identifying areas for improvement: Engagement metrics analysis enables businesses to identify areas where they may be falling short in terms of customer satisfaction and work to improve those areas.
2. Improving customer retention: Businesses here can validate customers who may be at risk of leaving and take steps to retain them.
3. Improving customer lifetime value: By understanding which customers are most engaged, businesses can focus on retaining and nurturing those customers, which can lead to increased revenue over the long term.
4. Benchmarking and tracking progress: Businesses get to benchmark their performance against industry standards and track progress over time, which can inform business decisions.
5. Cost-effective: Measuring customer engagement metrics is a relatively low-cost way to gain insight into your customers and improve your business.
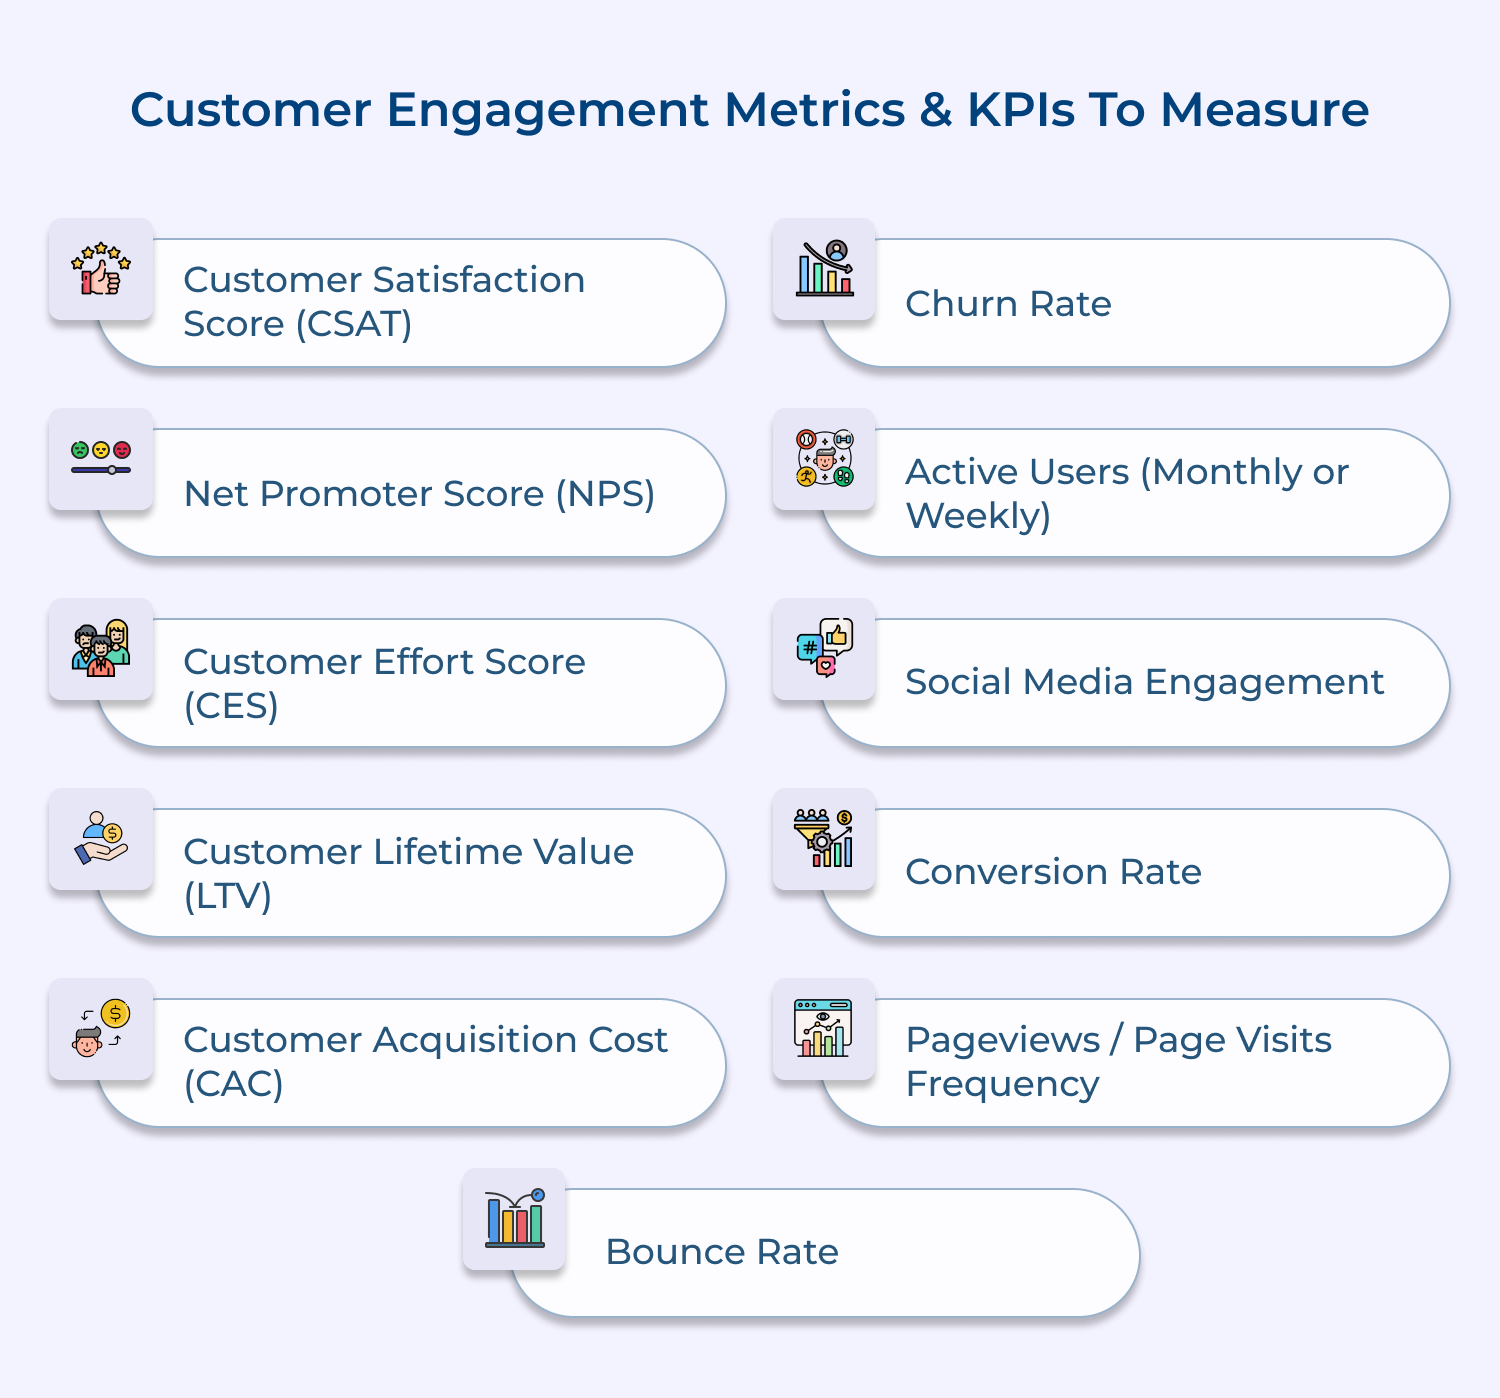
Here’s a comprehensive guide to the 11 customer engagement metrics and KPIs you should prioritize in 2026 to bolster your connection with customers and amplify your business growth.
The Customer Satisfaction Score (CSAT) is a common metric used to measure their satisfaction. It is typically calculated by surveying customers and asking them to rate their satisfaction with a product or service on a scale of 1-5 or 1-10, with higher scores indicating higher satisfaction.
You can track changes in customer satisfaction over time and to compare the satisfaction levels of different customer segments. It can also be used to identify areas where improvements are needed, such as by identifying which products or services have lower satisfaction scores.
CSAT scores are a self-reported metric which can be influenced by many factors like timing, survey design, survey questions and sample size. They are best used in combination with other metrics like Net Promoter Score (NPS) as well as customer effort score (CES) to get a more comprehensive picture of customer satisfaction.
CSAT can be collected through various methods like email, phone, web survey or in-person survey. The survey should be designed keeping in mind the customer journey, the questions should be easy to understand, and the survey should be to the point.
The Net Promoter Score (NPS) is a customer loyalty metric that measures the willingness of customers to recommend a company’s products or services to others. NPS is considered as a leading indicator of customer loyalty and future growth, as it measures the willingness of customers to recommend a company, which is a strong indicator of customer loyalty.
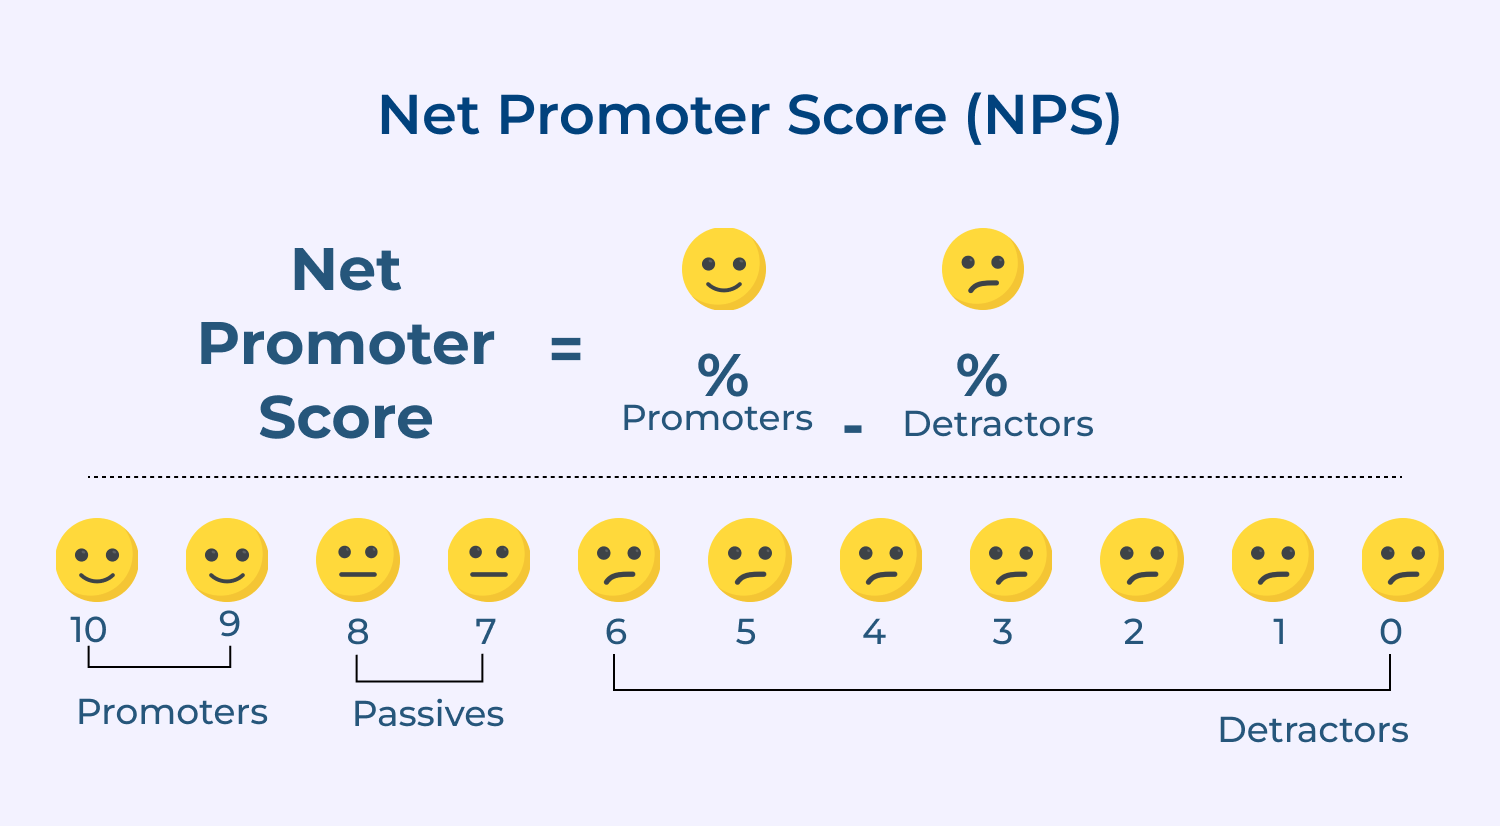
NPS is calculated by asking customers to rate their likelihood of recommending the company on a scale of 0-10, then grouping responses into three categories: promoters (9-10), passives (7-8), and detractors (0-6).
The surveys can be conducted through various channels like email, phone, web survey or in-person survey. It’s important to keep the survey to the point to ensure that it is delivered at the right time in the customer’s journey. It’s important to track NPS over time to understand the trend and to take action to improve it.
Here are some best practices to implement the Net Promoter Score (NPS) effectively:
Customer Effort Score (CES) is a metric that measures the effort that a customer has to put in to get a problem resolved or to complete a task.
Usually it is measured by asking customers to rate their experience on a scale, such as a 5-point scale, with 1 being “very low effort” and 5 being “very high effort.” Customers are typically asked to rate their experience with a company based on how easy or difficult it was to get their problem or question resolved.
High CES scores can indicate that customers are having difficulty getting their problems resolved or completing tasks, which can be a sign that the company’s customer service processes are not efficient or effective.
CES can also be used to track the customer experience over time to compare it across different channels, products, and segments. It helps businesses identify patterns in customer effort and use that information to make improvements as well as to gain a competitive edge.
Customer Lifetime Value (LTV) is a metric that represents the total value that a customer will bring to a business over the entire duration of their relationship with the company. It is calculated by multiplying the average revenue per customer by the average customer lifespan.
LTV is a valuable metric for businesses because it helps them understand the long-term value of their customers. It helps businesses to make informed decisions about marketing as well as sales strategies, such as determining how much to spend on acquiring new customers and how much to spend on retaining existing customers.
Calculating LTV can be done in a few different ways, but the most common way is to use the following formula:
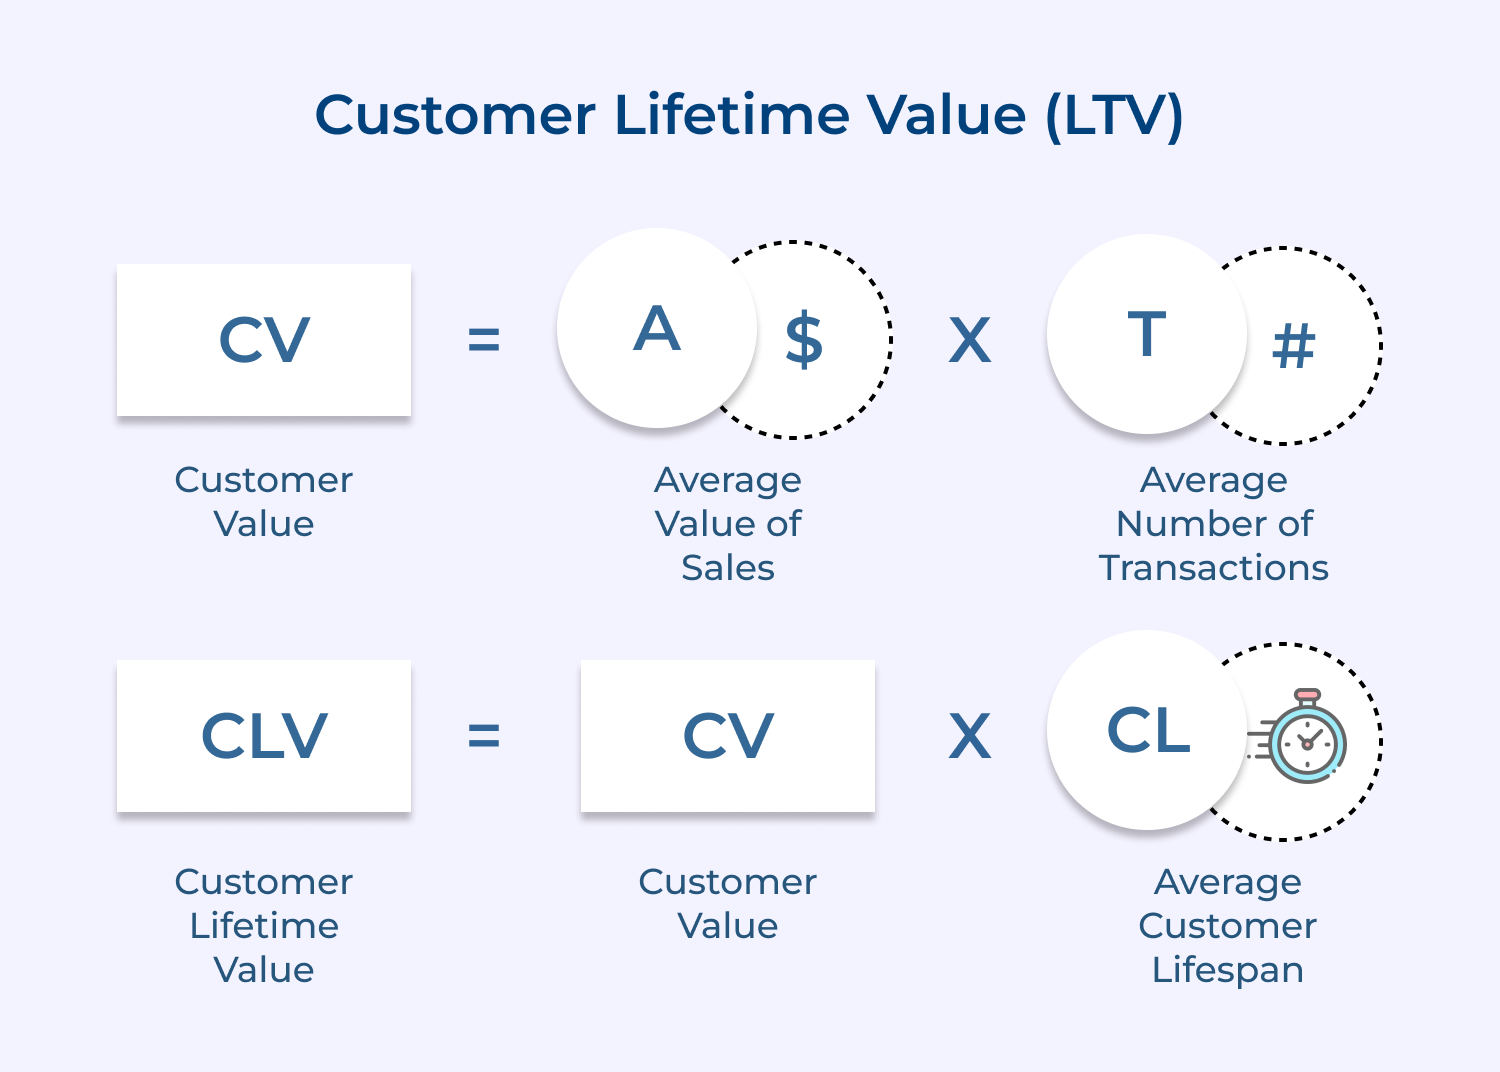
LTV = Average Revenue per Customer * Average Customer Lifespan
The calculated prediction is based on assumptions such as customer retention as well as the revenue per customer. Also, LTV can be different for different segments of the customer base, it’s a good idea to calculate it for each of them to have a clear view of the LTV in each segment.
LTV can also be used in conjunction with Customer Acquisition Cost (CAC) to determine the profitability of acquiring new customers. When you compare LTV to CAC, you’ll understand how much they can afford to spend on acquiring new customers and still be profitable.
Customer Acquisition Cost (CAC) is the cost associated with acquiring a new customer. The cost includes all of the expenses incurred in the sales as well as marketing efforts to attract and convert a prospect into a customer. It includes expenses such as advertising, sales salaries, bonuses, lead generation costs, and other expenses associated with the sales as well as marketing process.
CAC should be measured on a consistent basis using the same methodology, and that it should be tracked as well as monitored regularly to see if it’s improving or not over time.
To calculate Customer Acquisition Cost (CAC), you can use the following formula:
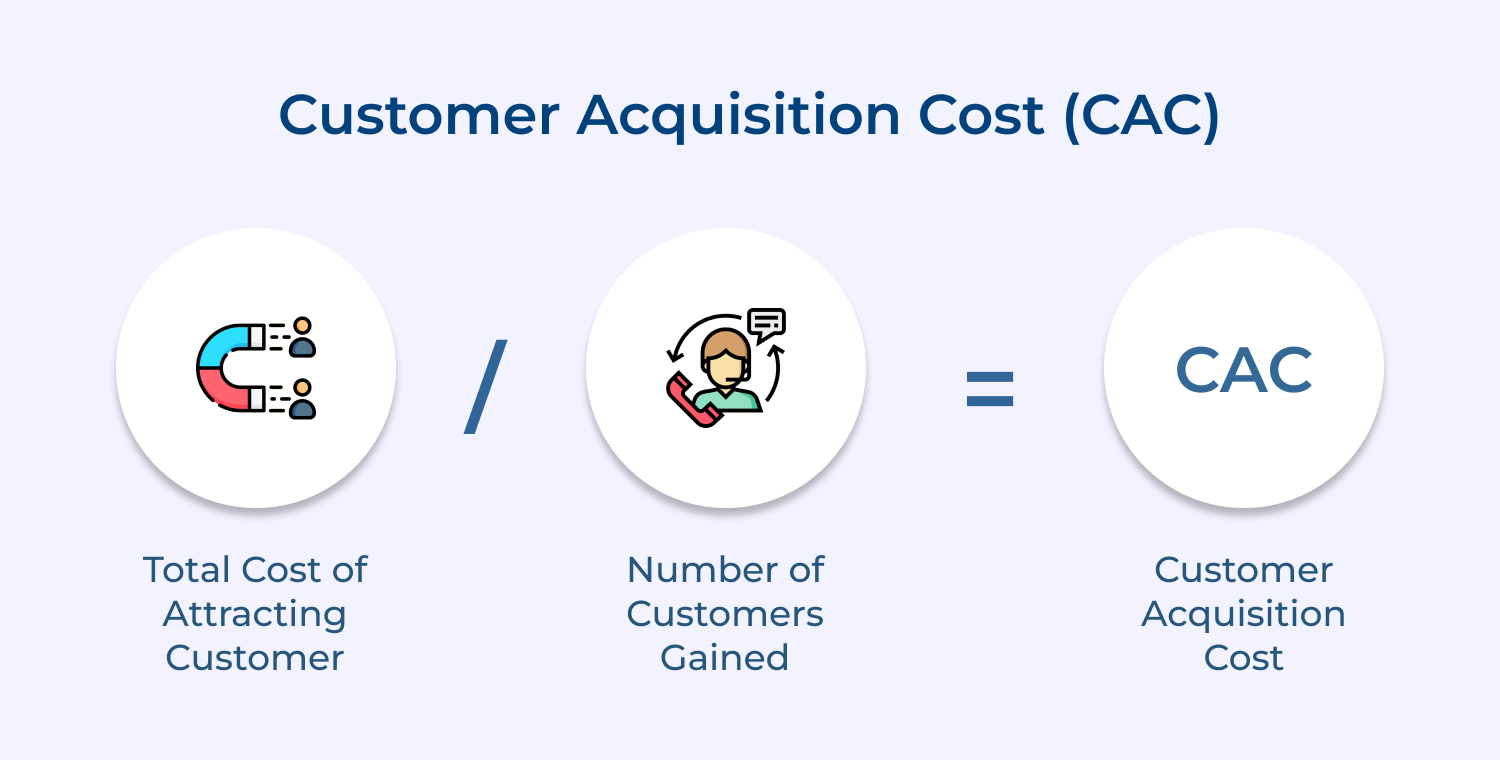
Here’s an example:
Let’s say a company spends $100,000 on sales as well as marketing expenses in a quarter and acquires 100 new customers during that time period. To calculate CAC:
CAC = $100,000 / 100 = $1,000
In example, the CAC is $1,000 per customer.
CAC can be different for different segments of the customer base, it’s a good idea to calculate it for each of them to have a clear view of the costs in each segment.
Customer churn rate is a metric that measures the rate at which customers are leaving a company. It is typically expressed as a percentage of total customers. A high churn rate can be a sign that a business is not effectively engaging with its customers and retaining them.
Customers that are not engaged with a company may be more likely to leave, which is why customer churn rate is closely related to customer engagement.
To calculate customer churn rate, you can use the following formula:
Churn rate = (Number of customers lost during a period / Total number of customers at the beginning of the period) x 100
A high churn rate can indicate that customers are not satisfied with the products or services provided by the company, or that they are not receiving adequate customer service.
Monthly or Weekly Active Users (MAU or WAU) are metrics that measure the number of unique users who have engaged with a product or service in a given time period, usually a month or a week. These metrics are often used to measure customer engagement in online platforms and mobile apps.
MAU or WAU is an important metric because it provides insights into the level of engagement users have with a product or service. A high number of MAU or WAU can indicate that users are actively and regularly engaging with a product or service, which can be an indication of customer satisfaction as well as loyalty.
Social media engagement is the process of monitoring and analyzing social media conversations to gain insights into customer sentiment, behavior or preferences. Here are some ways to measure customer engagement to improve customer service as well as marketing strategies.
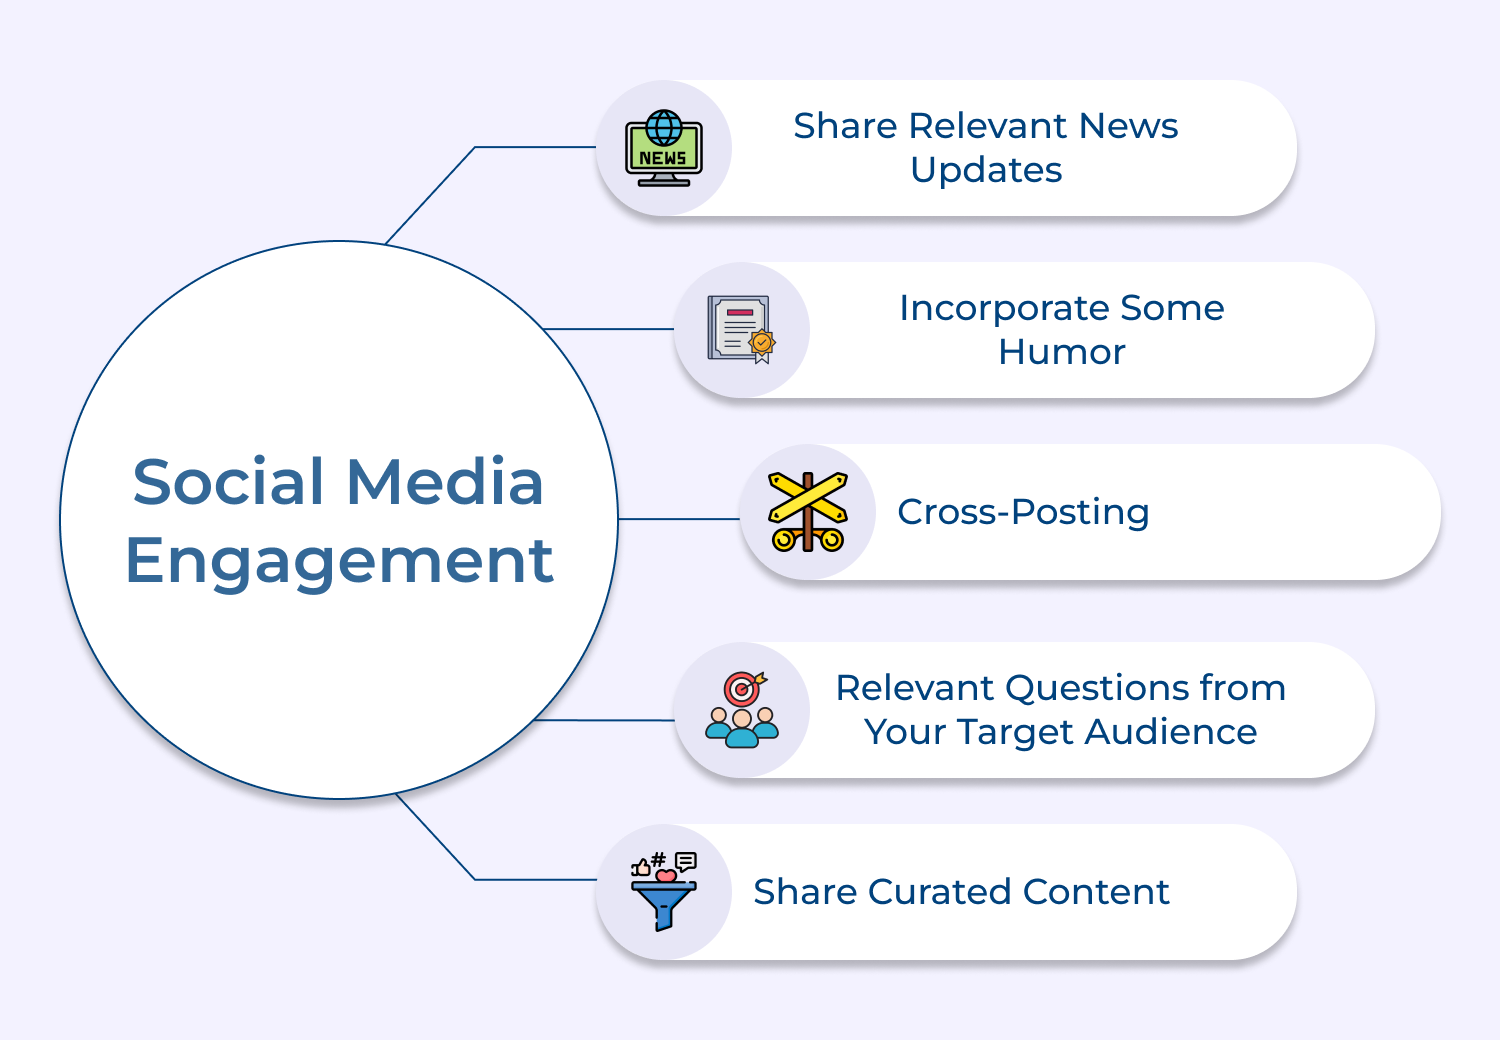
Conversion rate is a metric that measures the percentage of visitors to a website or mobile app that take a desired action, such as making a purchase, filling out a form, or subscribing to a newsletter.
Here are some examples of how conversion rate is commonly used in the Ecommerce or SaaS (Software as a Service) or any other online business.
Pageviews is a metric that measures the number of times a webpage has been viewed by users. It is used to measure customer engagement by providing insights into how often users are visiting a website and how much time they are spending on it.
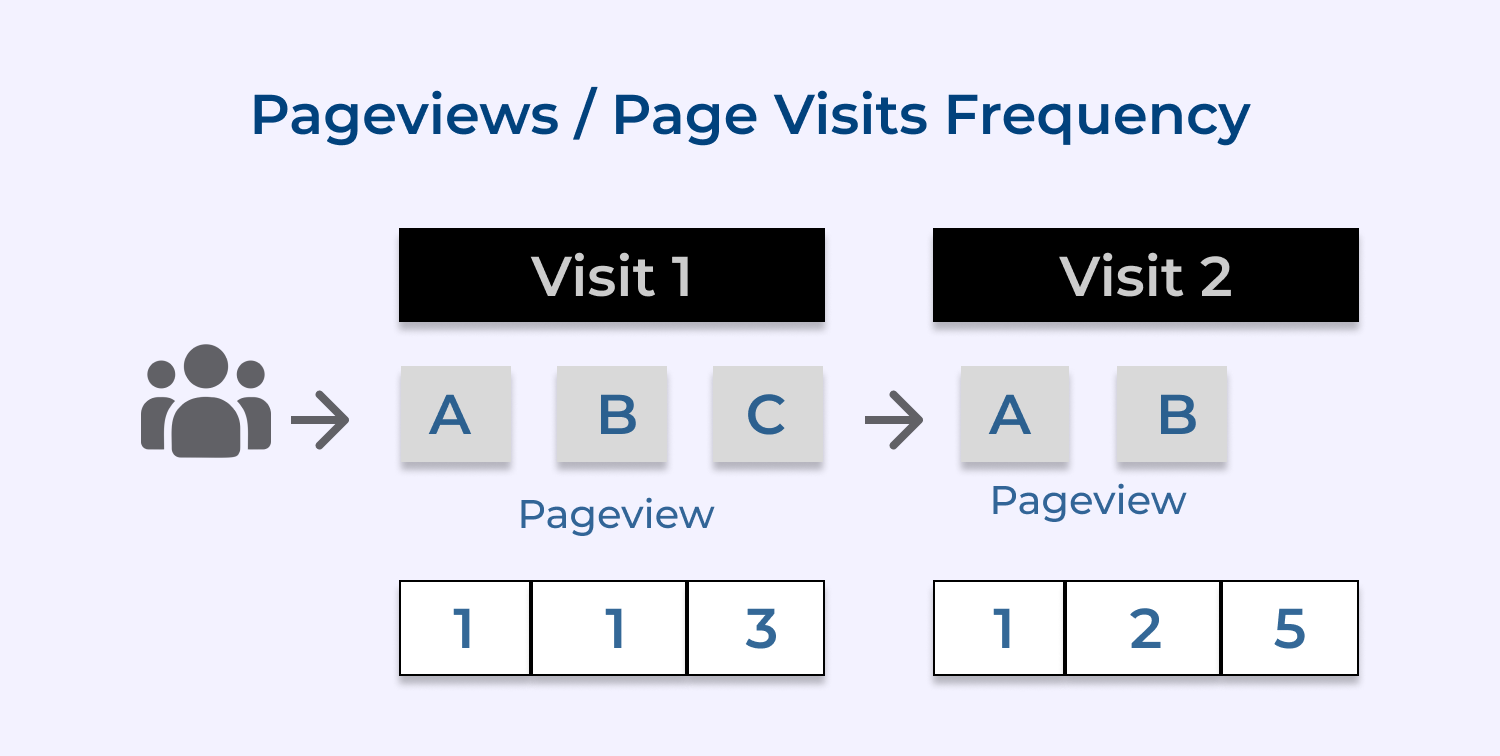
Pageviews should be used in conjunction with other metrics such as bounce rate, time on site, and conversion rate, to gain a comprehensive understanding of customer engagement
Bounce rate is a metric that measures the percentage of website visitors who leave a website after only visiting one page. You measure customer engagement by providing insights into how effectively a website is retaining visitors and keeping them engaged with its content.
Tracking metrics both before and after changes are made to engagement strategies to measure the impact of the changes. You learn what is working and what isn’t. Let’s explore.
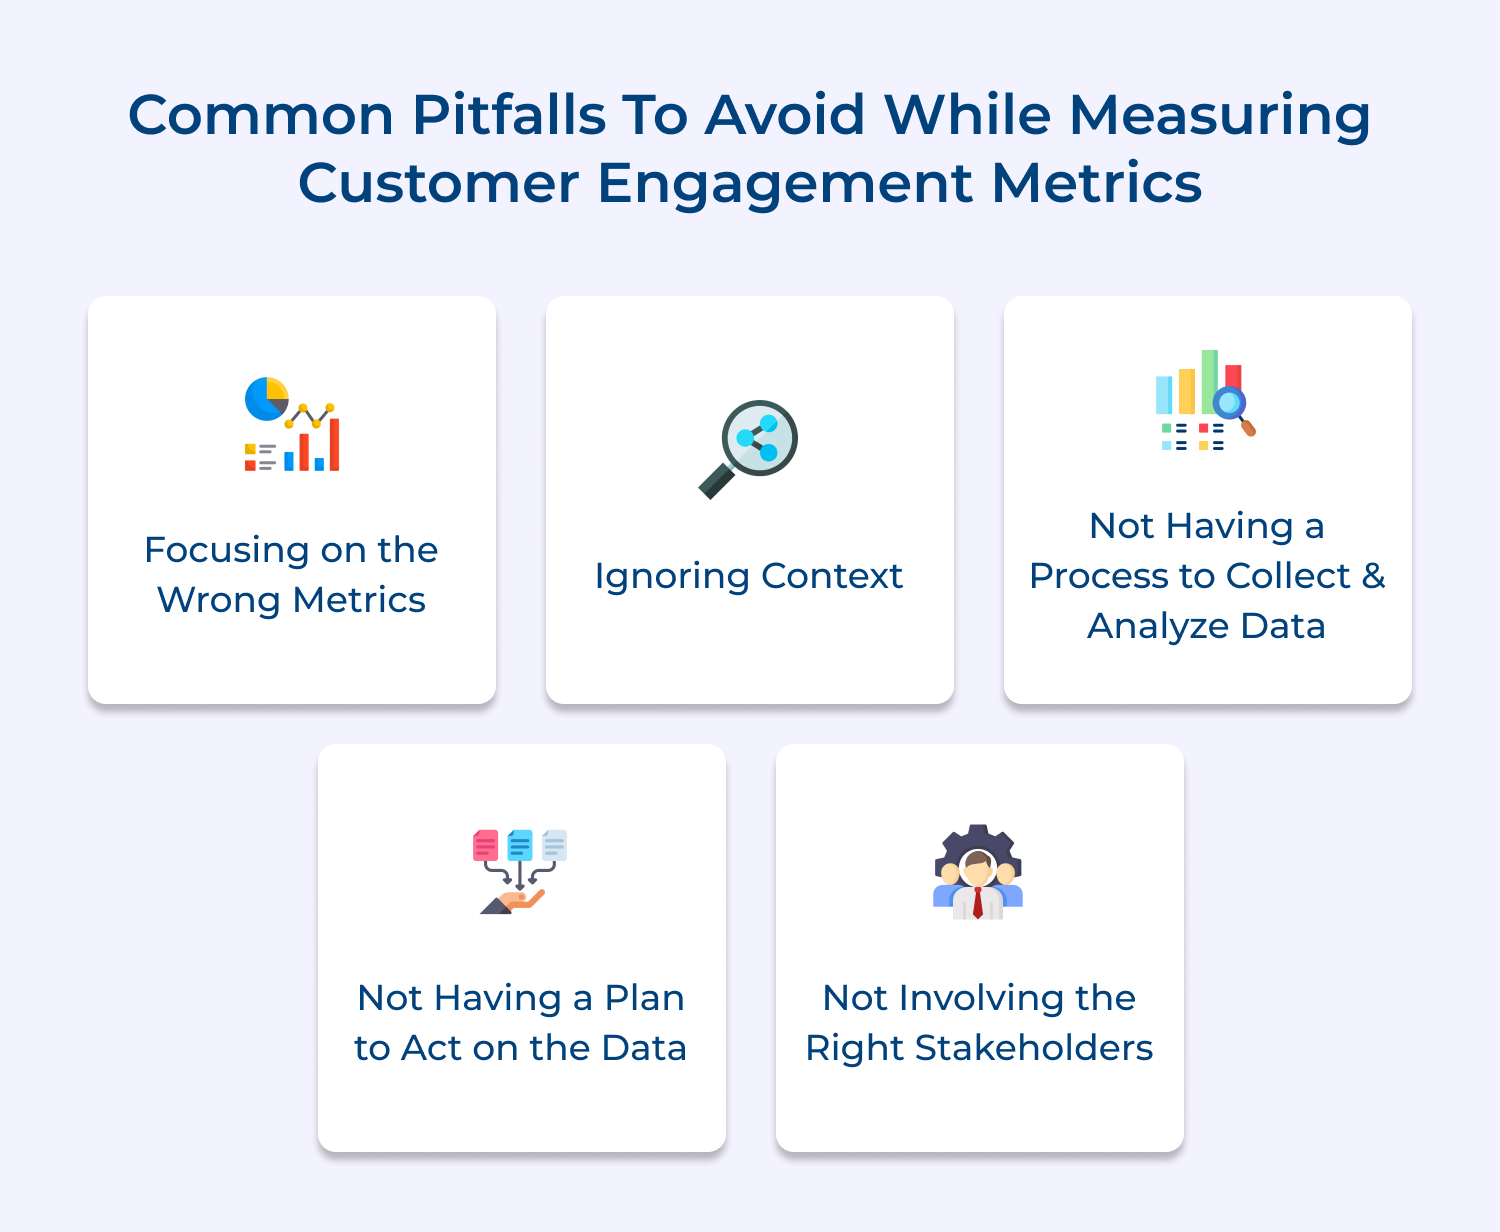
1. Focusing on the wrong metrics: Measure metrics that are relevant to your business and its goals. Selecting the wrong metrics or not aligning them with your business objectives can lead to inaccurate or misleading results.
2. Ignoring context: Metrics should be analyzed in the context of your industry, target audience, and overall business objectives. Failing to consider context can lead to misinterpretation of results.
3. Not having a process to collect & analyze data: Having a solid process in place to collect, analyze as well as interpret the data is critical to make sense of the metrics and to make informed decisions.
4. Not having a plan to act on the data: Collecting data is just the first step. Having a plan in place to act on the data is essential to make the most of the insights gained from measuring customer engagement metrics.
5. Not involving the right stakeholders: It’s important to involve the right stakeholders in the process of measuring customer engagement metrics, such as customer service, marketing, and product development teams.
Customer engagement is keeping consumers actively involved with your brand. It’s an important aspect of any business strategy, as engaged customers are more likely to make repeat purchases, refer your business to others, and provide valuable feedback.
Engagement metrics have evolved from simply measuring sales figures to a more holistic approach. It’s essential to have a comprehensive set of metrics and KPIs in place
to truly gauge the success of your customer engagement efforts.
The metrics such as click-through rates, time spent on a website, conversion rates, and social media engagement provide valuable insights. These insights can then be used to refine marketing strategies, enhance customer experiences, and drive business growth.

What is the difference between customer engagement and customer experience?
Customer engagement refers to the interactions between a brand and its customers. It involves building a relationship, keeping customers involved, while also encouraging loyalty. Customer experience encompasses the overall impression a customer has with a brand throughout the entire customer journey, from initial contact to post-purchase activities. Customer engagement focuses on interactions, while customer experience focuses on the overall perception.
Which is the most important customer engagement KPI?
One of the most important KPIs for customer engagement is the customer engagement rate. It measures the percentage of customers who actively engage with a brand’s content, such as liking, commenting, or sharing on social media. Other important customer engagement KPIs include click-through rate, conversion rate, and customer satisfaction scores.
Are customer engagement metrics and customer retention metrics the same?
Although customer engagement and customer retention are related, the metrics used to measure them differ. Customer engagement metrics focus on tracking the level of interaction as well as involvement customers have with a brand, such as website visits, social media likes, comments, and shares. Customer retention metrics measure the ability of a brand to retain its existing customers over a specified period. These metrics could include customer retention rate, churn rate, as well as repeat purchase rate.
How can customer engagement metrics contribute to understanding customer behavior?
User engagement metrics provide valuable insights into customer behavior by indicating how customers interact with a company and its offerings. By analyzing engagement metrics, marketers learn which channels, campaigns, or content generate the most interest and attract the highest levels of engagement. The data helps in tailoring marketing strategies, personalizing customer experiences, and identifying areas for improvement.
 https://omni24.io/wp-content/uploads/2026/08/AI-Customer-Service-Agents.png
1256
2400
Webvision Solution
https://omni24.io/wp-content/uploads/2023/04/Omni-Logo-1.svg
Webvision Solution2026-09-21 04:48:512026-09-21 04:48:51How to Build an AI Customer Service Agents: 8 Key Steps
https://omni24.io/wp-content/uploads/2026/08/AI-Customer-Service-Agents.png
1256
2400
Webvision Solution
https://omni24.io/wp-content/uploads/2023/04/Omni-Logo-1.svg
Webvision Solution2026-09-21 04:48:512026-09-21 04:48:51How to Build an AI Customer Service Agents: 8 Key Steps https://omni24.io/wp-content/uploads/2026/08/Omnichannel-Conversational-AI.png
1256
2400
Tushar Joshi
https://omni24.io/wp-content/uploads/2023/04/Omni-Logo-1.svg
Tushar Joshi2026-09-16 03:51:072026-09-16 03:51:07How to Build Omnichannel Conversational AI Strategy
https://omni24.io/wp-content/uploads/2026/08/Omnichannel-Conversational-AI.png
1256
2400
Tushar Joshi
https://omni24.io/wp-content/uploads/2023/04/Omni-Logo-1.svg
Tushar Joshi2026-09-16 03:51:072026-09-16 03:51:07How to Build Omnichannel Conversational AI Strategy https://omni24.io/wp-content/uploads/2026/08/Customer-Service-Teams.png
1256
2400
Tushar Joshi
https://omni24.io/wp-content/uploads/2023/04/Omni-Logo-1.svg
Tushar Joshi2026-09-15 04:01:522026-09-15 04:02:16How to Build Customer Service Teams: 6 Key Steps
https://omni24.io/wp-content/uploads/2026/08/Customer-Service-Teams.png
1256
2400
Tushar Joshi
https://omni24.io/wp-content/uploads/2023/04/Omni-Logo-1.svg
Tushar Joshi2026-09-15 04:01:522026-09-15 04:02:16How to Build Customer Service Teams: 6 Key Steps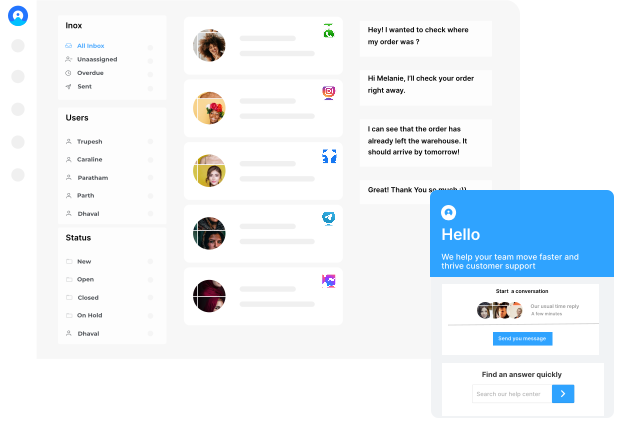
Whether it’s about acquire, engage or support – Omni24 covers all your customer engagement needs in one complete platform.

Copyright ©2026 Veemo All rights reserved.
CA, Los Angeles, Hall Ave, 19011